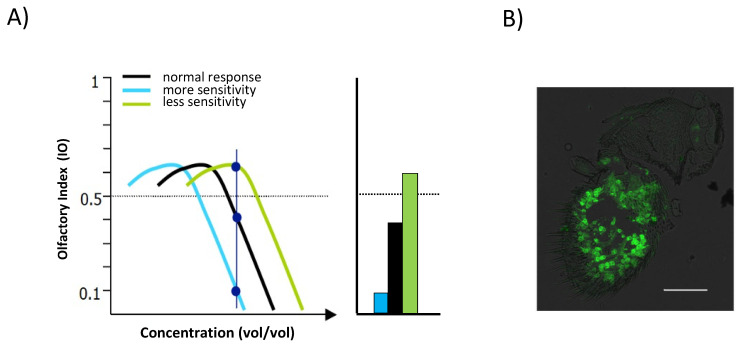
Figure 3.
Representative dose–response curve in the T-maze. (A) Representation of the typical dose-response curve in the T-maze in response to increasing concentrations of odor (left). Testing a single odorant concentration, corresponding to the vertical blue line in the dose–response curve, in the repellent region for normal flies (black) allows detecting changes in sensitivity in both directions, either less sensitive flies (green) or more sensitive flies (blue). IO mean values are represented in the histogram (right). Note that in this case the higher IO values correspond to diminished sensitivity and the lower values to increased sensitivity. (B) Representative immunostaining of the main olfactory organ of Drosophila where the OSNs expressing the Orco co-receptor cover the entire surface of the third antennal segment. Green Fluorescent Protein (GFP) directed expression in these OSNs is shown in green. Scale bar, 30 μm.

