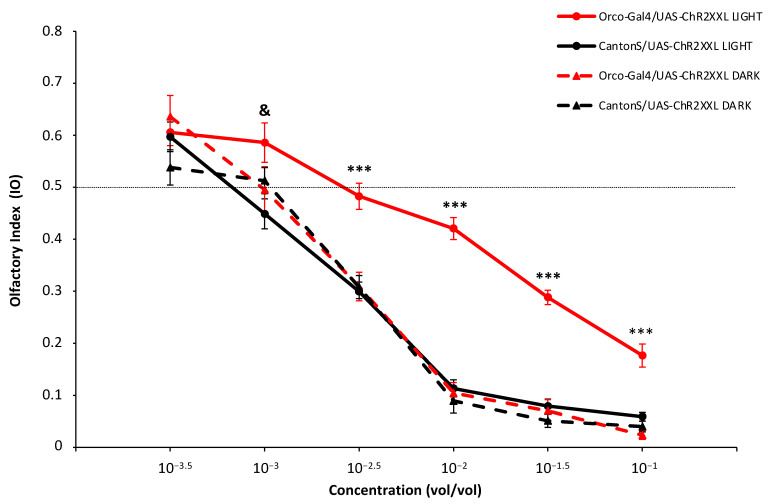
Figure 4.
Olfactory behavior with optogenetic activation of Orco-expressing Olfactory Sensory Neurons (OSNs). Dose–response curve of olfactory responses to ethyl acetate in four fly genotypes. Each point shows the average Olfactory Index (IO) ± SEM for each concentration, genotype and light condition. At the 10−3 concentration, only differences between Orco-Gal4/UAS-Chr2XXL LIGHT and CantonS/UAS-ChR2XXL LIGHT became statistically significant (& = p < 0.05). For the 10−2.5 to 10−1 concentrations, highly significant differences (*** = p < 0.001) appeared between Orco-Gal4/UAS-Chr2XXL LIGHT and the other 3 classes, which were equal to each other.

