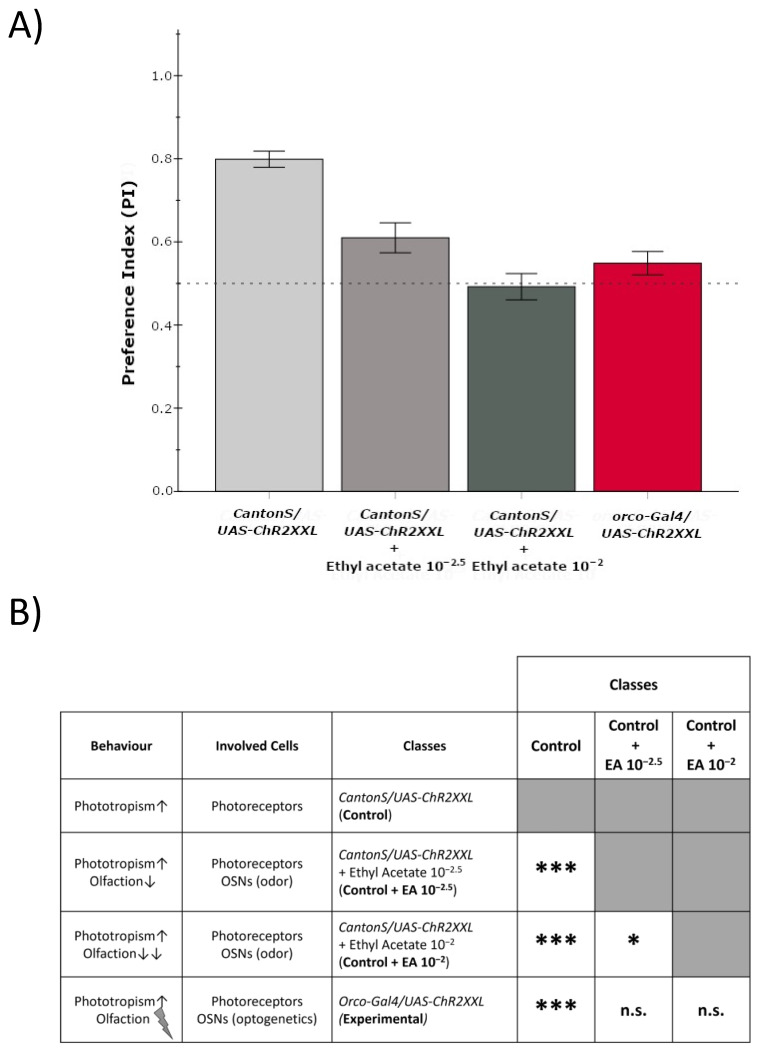
Figure 5.
Phototropism vs. Olfactory Response. (A) Response to light of experimental individuals (Orco-Gal4/UAS-Chr2XXL) with optogenetic activation of Orco-expressing Olfactory Sensory Neurons (OSNs) compared with control individuals (CantonS/UAS-ChR2XXL) responding to light or a combination of light and odor (Ethyl Acetate 10−2.5 and 10−2). Bars represent Mean PI ± SEM. (B) Table of significant differences. The behavior and cells involved in the response of each of the four classes compared are presented along the significant differences found among the classes. (* = p < 0.05; *** = p < 0.001; n.s. = not significant differences). The white squares represent all possible two-by-two comparisons. The gray squares correspond to nonsense or repeated comparisons.

