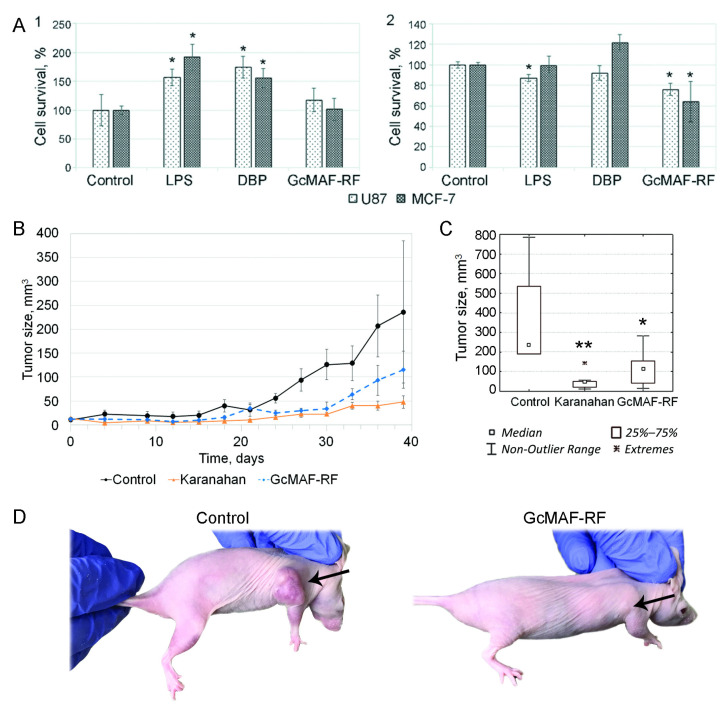
Figure 4.
The antitumor effect of GcMAF-RF. (A) The cytotoxic effect of GcMAF-RF on U87 and MCF-7 cancer cells. 1—direct cytotoxicity; 2—PM-mediated cytotoxicity. Mean ± SD values are shown (n = 3); * p < 0.05—significance of differences compared to the control (Mann–Whitney U test). (B–D) The effects of Karanahan therapy and GcMAF-RF administration alone on human U87 glioblastoma inoculated subcutaneously in immunodeficient mice. (B) Graph demonstrating growth of a human U87 glioblastoma graft. Mean ± SEM values are shown. (C) Graph showing graft volumes at the terminal stage (39 days after therapy initiation). Significance of differences (* p < 0.05; ** p < 0.01, Mann–Whitney U test). (D) Photographs of control group mice and animals receiving GcMAF-RF, 39 days after therapy initiation. Arrows indicate tumors.

