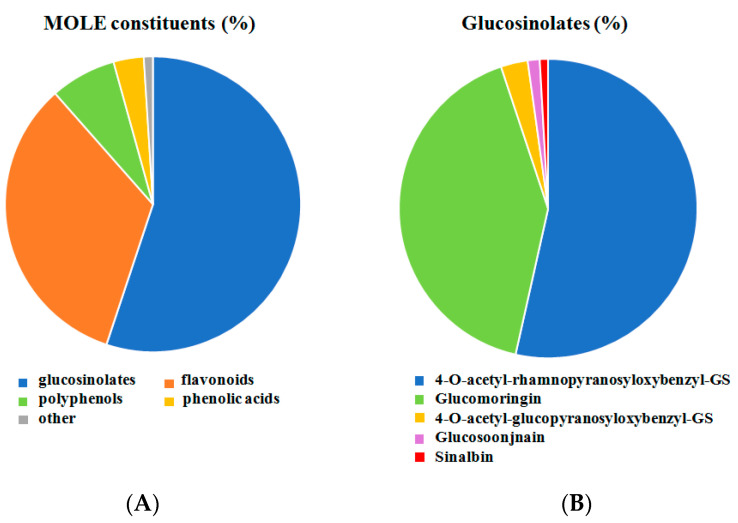
Figure 1.
Relative amounts of constituents of MOLE. Metabolomic analysis was performed on MOLE working solution. Relative percent of different categories of compound was shown in panel (A). SWATH MS/MS spectrum of MOLE extract was performed for glucosinolates analysis. Relative percent were shown in panel (B).

