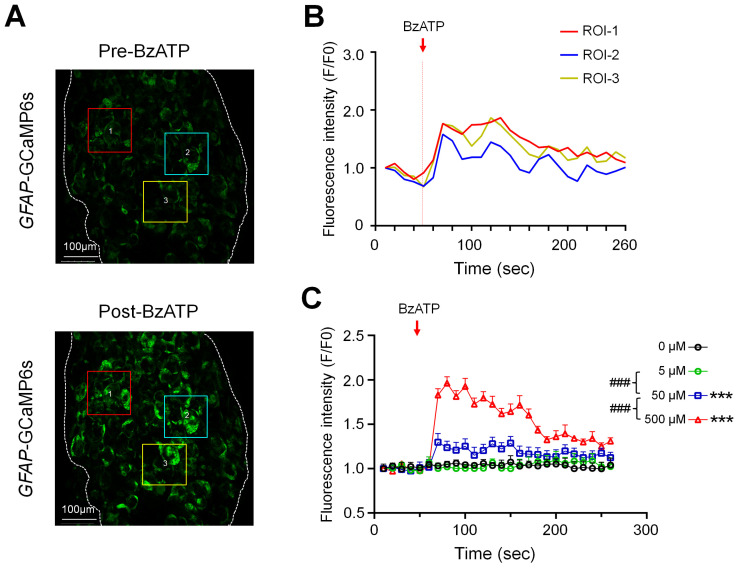
Figure 1.
Concentration-dependent responses of satellite glial cells (SGCs) to the ganglionic application of BzATP. (A) Representative images illustrate the fluorescence intensity of SGCs at baseline (Frames (F)1–5, 10 s/frame) and 0–20 s (F6–7) after ganglionic application of BzATP (500 µM) in GFAP-GCaMP6s mice. For illustrative purposes, three regions of interest (ROIs) are marked with colored boxes and numbered. (B) Fluorescence intensity traces (F/F0) of the ROIs shown in (A) before and after the BzATP (500 µM) treatment. Fluorescence intensity was measured for each frame (10 s/frame) and plotted against time or frame number. (C) SGC responses in GFAP-GCaMP6s mice were quantified by measuring the averaged fluorescence intensity in the whole imaging field before (F0) and after (F) drug treatment. Fluorescence intensity was measured for each frame and plotted against time after ganglionic application of BzATP (5, 50, 500 µM, n = 6 mice/dose). The red arrow indicates the time of drug application. Data are expressed as mean ± SEM. *** p < 0.001 versus vehicle (0 µM); ### p < 0.001 versus indicated group. Two-way repeated measures ANOVA.

