Figure 2.
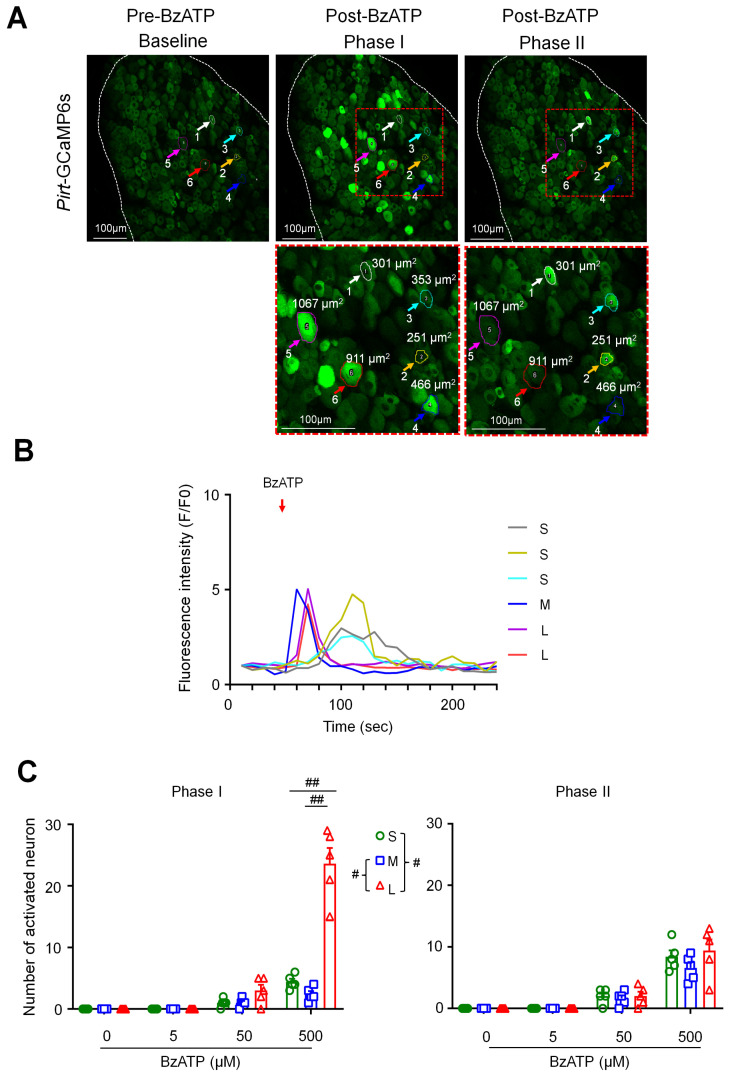
BzATP activates more large than small dorsal root ganglion (DRG) neurons in phase I. (A) Upper: Representative images showing changes in fluorescence intensity of L4 DRG neurons after ganglionic administration of BzATP (500 µM) in Pirt-GCaMP6s mice during in vivo calcium imaging in anesthetized mice. Baseline (Frames (F)1–5, 10 s/frame), phase I (F6–7), and phase II post-drug (F8–26). Examples of activated neurons are marked by colored circles and arrows. Lower: The red-outlined areas in phase I and phase II image are shown at higher magnification. DRG neurons were categorized according to the somal area as <450 μm2 (small, S), 450–700 μm2 (medium, M), and >700 μm2 (large, L). (B) Fluorescence intensity traces (F/F0) of selected neurons activated by BzATP in (A). Red arrow indicates the time of drug application. (C) Number of neurons in each subpopulation that were activated by BzATP (5, 50, 500 µM, n = 6 mice) in phase I (F6–7) and phase II (F8–26). Data are expressed as mean ± SEM. # p < 0.05, ## p < 0.01 versus indicated group. Two-way mixed-model ANOVA with Dunnett’s multiple comparisons test.

