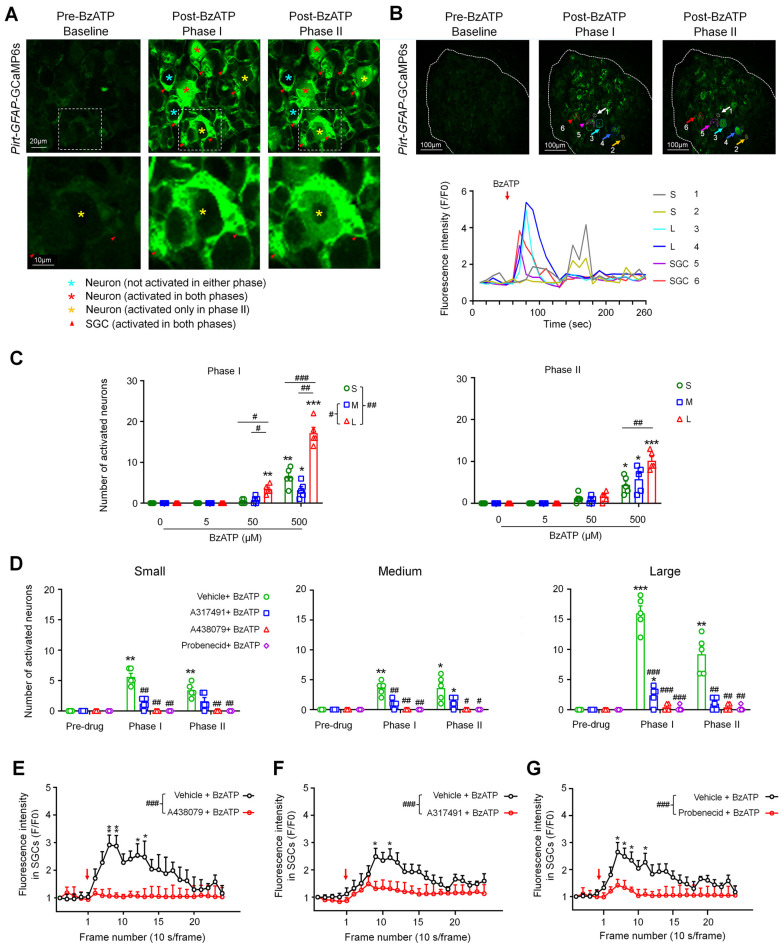
Figure 3.
Pretreatment with A317491, A438079, and probenecid inhibited the activation of neurons and satellite glial cells (SGCs) by BzATP. (A) Upper: Representative images showing DRG neurons and SGCs after ganglionic administration of BzATP (100 µM) in Pirt:GFAP-GCaMP6s mice. Baseline (Frames (F)1–5, 10 s/frame), phase I (F6–7), and phase II post-drug (F8–26). Lower: The high-magnification images of the boxes outlined in the upper panel. (B) Upper: Examples of activated neurons (#1–4) and SGCs (#5–6) are marked with colored circles and arrows. DRG neurons were categorized by somal area as <450 μm2 (small, S), 450–700 μm2 (medium, M), and >700 μm2 (large, L). Lower: Fluorescence-intensity traces (F/F0) of DRG neurons and SGCs activated by BzATP. (C) Number of neurons in each subpopulation activated by BzATP (5, 50, 500 µM, n = 6 mice) in phase I and phase II. Data are expressed as mean ± SEM. * p < 0.05, ** p < 0.01, *** p < 0.001 versus vehicle (0 µM); # p < 0.05, ## p < 0.01, ### p < 0.001 versus indicated group. Two-way mixed-model ANOVA with Dunnett’s multiple comparisons test. (D) Number of neurons in each subpopulation that were activated by BzATP (100 µM) after pretreatment with vehicle (ACSF), the P2X3R antagonist A317491 (100 µM), the P2X7R antagonist A438079 (100 µM), or the Panx1 antagonist probenecid (1 mM; n = 6 mice/group). Data are expressed as mean ± SEM. * p < 0.05, ** p < 0.01, *** p < 0.001 versus pre-drug; # p < 0.05, ## p < 0.01 versus vehicle + BzATP in the same phase. Two-way mixed-model ANOVA with Tukey’s multiple comparisons test. (E–G) Average SGC fluorescence intensity produced by BzATP (100 µM) application after pretreatment with A438079 (100 µM, n = 6 mice, E), A317491 (100 µM, n = 5 mice, F), probenecid (1 mM, n = 6 mice, G), or vehicle (ACSF, n = 6 mice). Fluorescence was measured for each frame and then plotted against time. Red arrow indicates the time of drug application. The curves representing the changes in fluorescence intensity after different drug treatments were compared between groups. Data are expressed as mean ± SEM. * p < 0.05, ** p < 0.01 versus antagonist + BzATP; ### p < 0.001. Two-way mixed-model ANOVA with Tukey’s multiple comparisons test.

