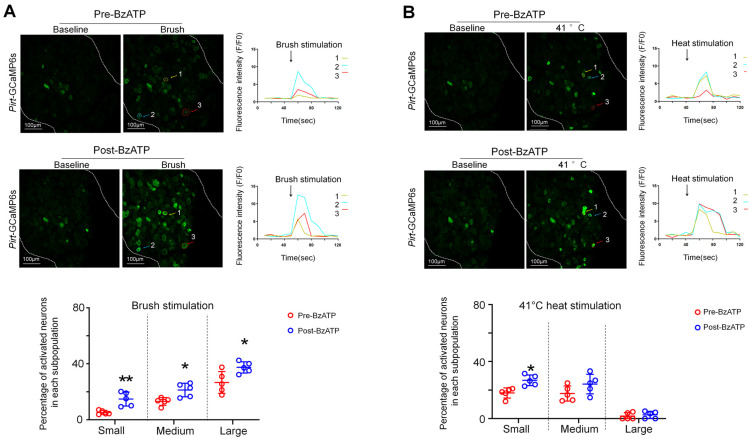
Figure 4.
Changes in the percentage of DRG neurons that respond to brush and heat stimulation after ganglionic application of BzATP. (A) Upper: Representative images show L4 DRG neuronal fluorescence in response to brush stimulation (~1 Hz for 10 s) at the hind paw before and 5 min after BzATP (100 µM) application in Pirt-GCaMP6s mice. Fluorescence-intensity traces (F/F0) of the activated neurons marked with colored arrows. Lower: Percentage of neurons in each size of population that responded to brush stimulation before and after BzATP treatment (n = 5 mice). DRG neurons were categorized according to somal area as <450 μm2 (small), 450–700 μm2 (medium), and >700 μm2 (large). (B) Upper: Representative images show neuronal fluorescence in response to non-noxious heat stimulation of the hind paw (41 °C water bath, 10 s) before and 10 min after BzATP (100 µM) application. Lower: Percentage of neurons in each subpopulation that responded to heat stimulation (n = 5 mice). Data are expressed as mean ± SEM. * p < 0.05, ** p < 0.01 versus pre-drug. Paired t-test.

