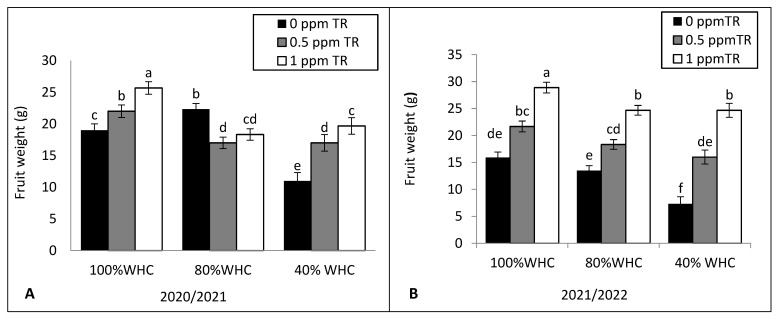
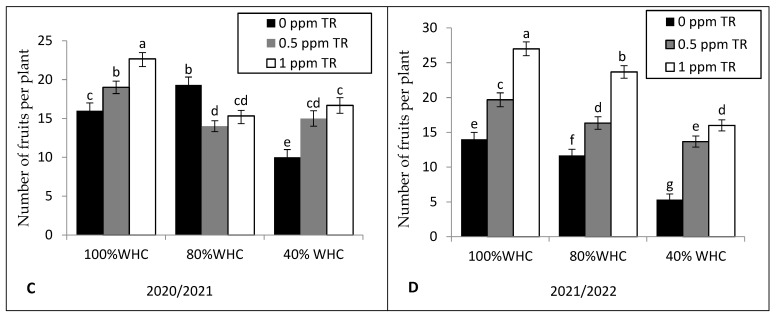
Figure 3.
Effects of the interaction between water irrigation levels and foliar application with TR interaction on (A,B) fruit weight in 2020 and 2021 and (C,D) number of fruits per plant in 2020 and 2021. Vertical bars represent standard errors of the mean; in each bar, values followed by different letters differ significantly at p = 0.05 according to the LSD test.


