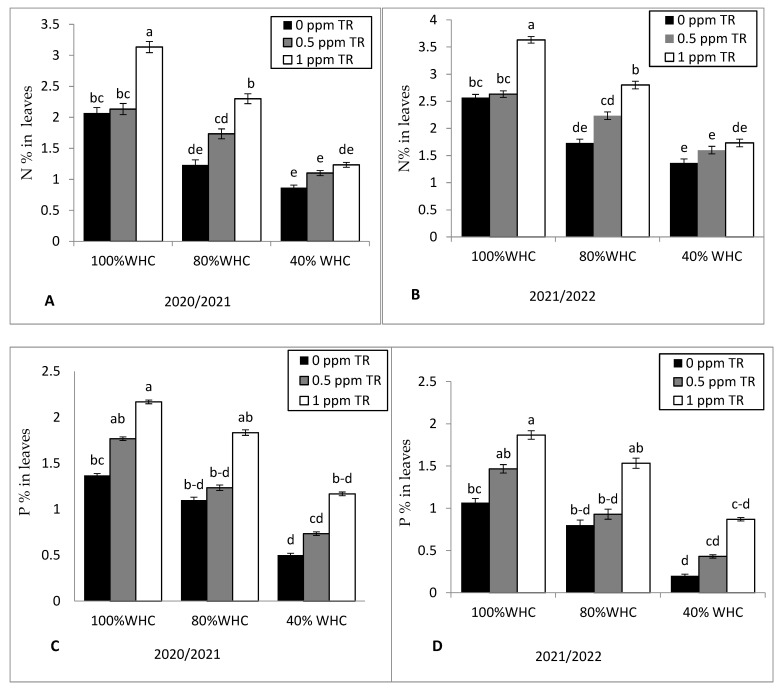
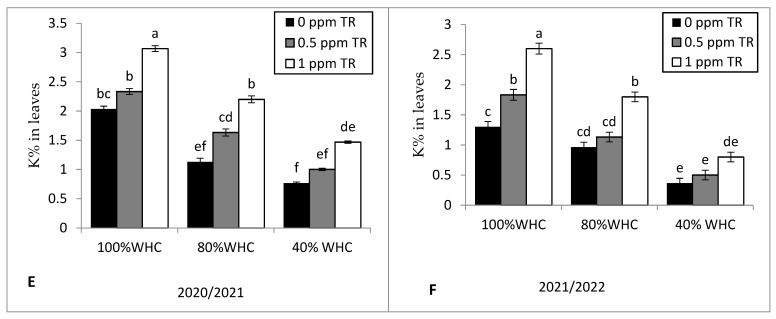
Figure 6.
Effects of water irrigation levels and foliar application with TR interaction on (A,B) N% in leaves of strawberry in 2020 and 2021, (C,D) P% in leaves in 2020 and 2021, and (E,F) K% in leaves of strawberry in 2020 and 2021. Vertical bars represent standard errors of the mean; in each bar, values followed by different letters differ significantly at p = 0.05 according to the LSD test.


