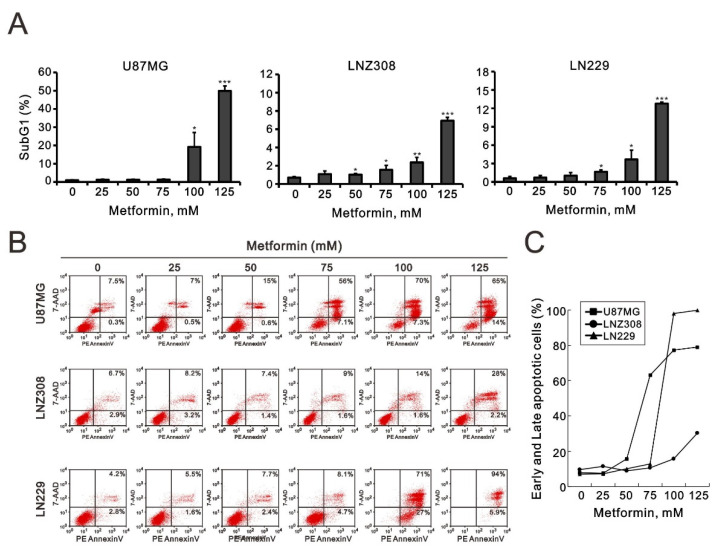
Figure 2.
The effects of metformin on the cell-cycle profile and cellular apoptosis in GBM cell lines. (A) U87MG, LNZ308, and LN229 cells were treated with the indicated metformin concentrations for 24 h. The population of cells in the sub-G1 phase of the cell cycle was measured using flow cytometry analysis and statistically plotted. * p < 0.05, ** p < 0.01, and *** p < 0.001. (B) U87MG, LNZ308, and LN229 cells were treated with the indicated metformin concentrations for 24 h. Cells were stained with PE–annexin V and 7-AAD and were measured using flow cytometry analysis. Their quantification of early and late apoptotic cells showed as (C).

