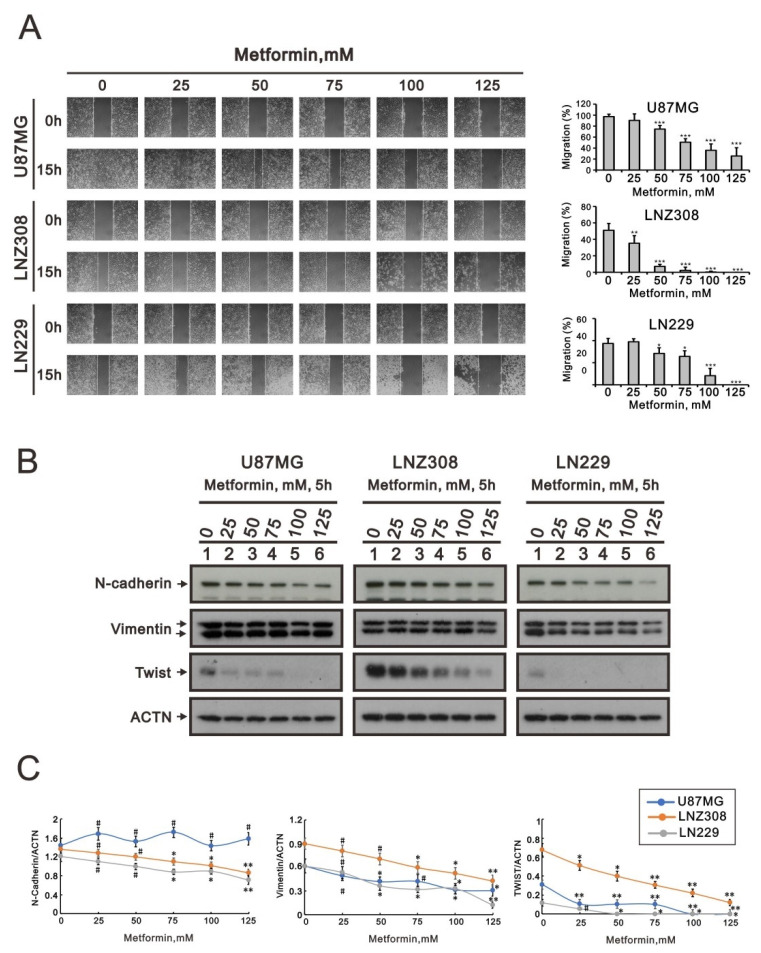
Figure 3.
The effects of metformin on cell migration and EMT in GBM cell lines. (A) U87MG, LNZ308, and LN229 cells were treated with the indicated metformin concentrations. After 15 h, the cell migration was measured; * p < 0.05 and *** p < 0.001. (B) U87MG, LNZ308, and LN229 cells were treated with the indicated metformin concentrations for 5 h. Cell lysates were subjected to Western blot analysis using antibodies against the indicated proteins; ACTN was used as the protein-loading control. The protein bands were quantified through pixel density scanning and evaluated using ImageJ, version 1.44a (http://imagej.nih.gov/ij/) (accessed on 15 July 2022). (C) The ratios of N-cadherin/ACTN, Vimentin/ACTN, and TWIST/ACTN were plotted in the U87MG, LNZ308, and LN229 cells. The results are representative of three independent experiments. # p > 0.05, * p < 0.05, ** p < 0.01, and *** p < 0.001.

