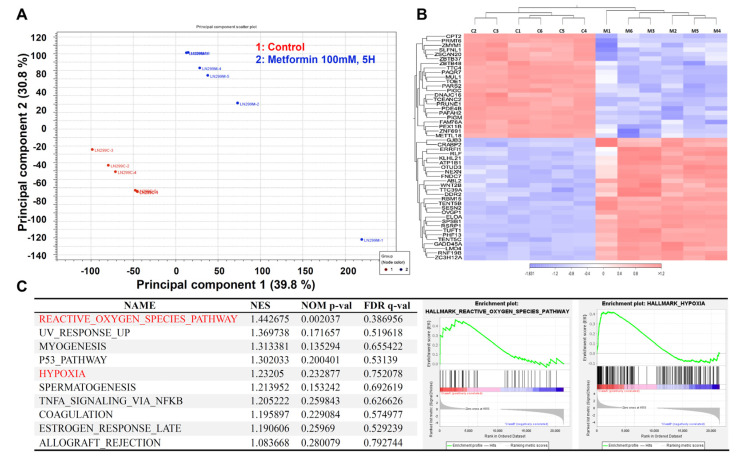
Figure 4.
The effect of metformin on the transcriptome of LN229 cells. LN229 cells were treated with vehicle or 100 mM metformin for 5 h. Total RNA was extracted for RNA sequencing analysis. (A) PCA revealing different clusters of metformin-treated and control cells. (B) Heatmap showing the top differentially expressed genes in both groups. (C) GSEA study highlighting the increase in ROS and hypoxia in metformin-treated LN229 cells.

