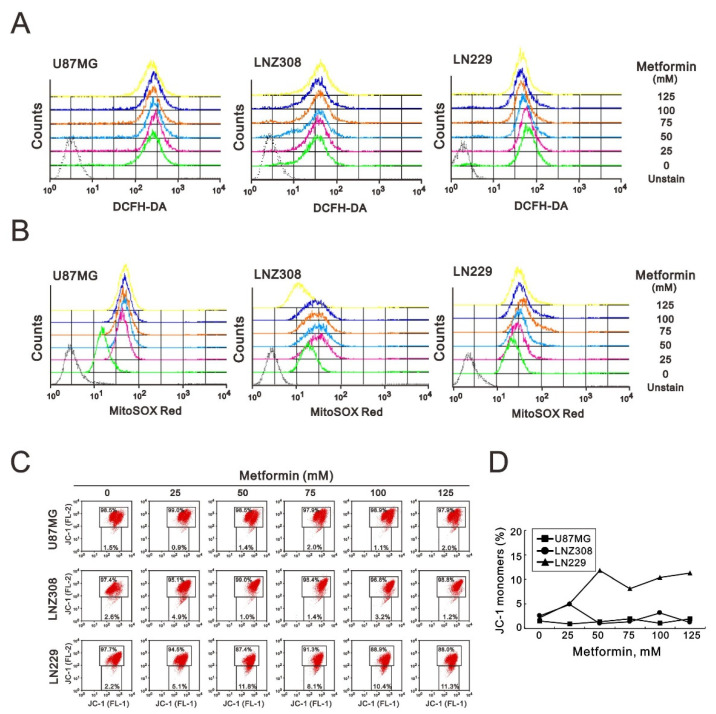
Figure 5.
The effects of metformin on cytosolic ROS, mitochondrial ROS, and mitochondrial membrane potential in GBM cells. U87MG, LNZ308, and LN229 cells were treated with the indicated metformin concentrations. After 3 h, (A) the cytosolic ROS was measured with DCFH-DA, and (B) the mitochondrial ROS was measured with the MitoSOX Red kit using flow cytometry analysis. (C) U87MG, LNZ308, and LN229 cells were treated with the indicated metformin concentrations for 5 h. The integrity of the mitochondrial membrane potential was measured with JC-1 dye using flow cytometry analysis. Their quantification of monomer (FL-1, green fluorescence) form of the dye showed as (D).

