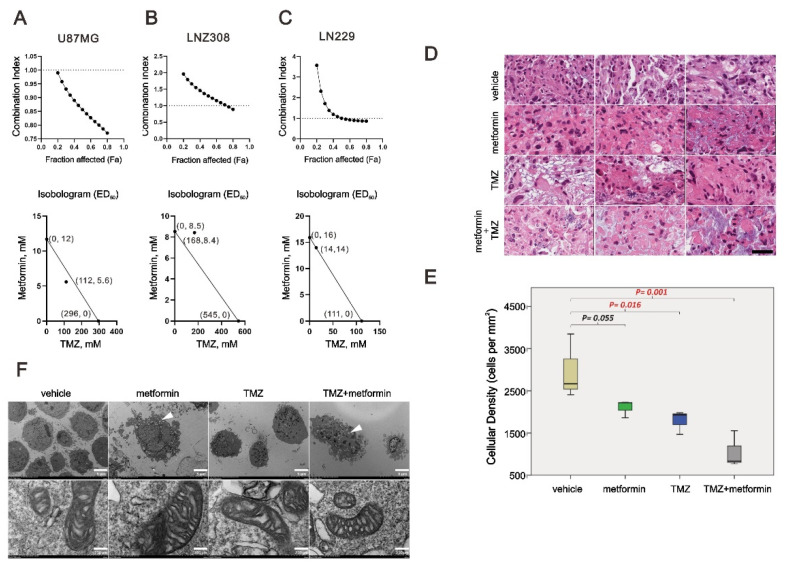
Figure 7.
The combination index of TMZ and metformin in GBM cells. U87MG, LNZ308, and LN229 cells were treated with 0, 15.625, 31.25, 62.5, 125, 250, 500, 1000, 2000 m, and 4000 µM TMZ and 0, 3.125, 6.25, 12.5, 25, 50, 100, and 200 mM metformin for 72 h. Metabolic activity was measured using MTS assays. The combination index of TMZ plus metformin in U87MG (A), LNZ308 (B), and LN229 (C) cells. Isobolograms (ED50) of TMZ or metformin were calculated using CalcuSyn software. (D,E) Patient-derived organoid culture was separated into four groups with different drug supplements, including Vehicle, 50 mM metformin, 100 µM TMZ, and combined 50 mM metformin with 100 µM TMZ. Scale bar = 50 μm. (F) LN229 cells were treated with 50 mM metformin, 12.5 µM TMZ, or their combination. After 48 h, the detailed mitochondrial structure of LN229 cells was investigated using the H-7500 TEM. Scale bar = 5 μm (top) and 250 μm (bottom).

