Figure 2.
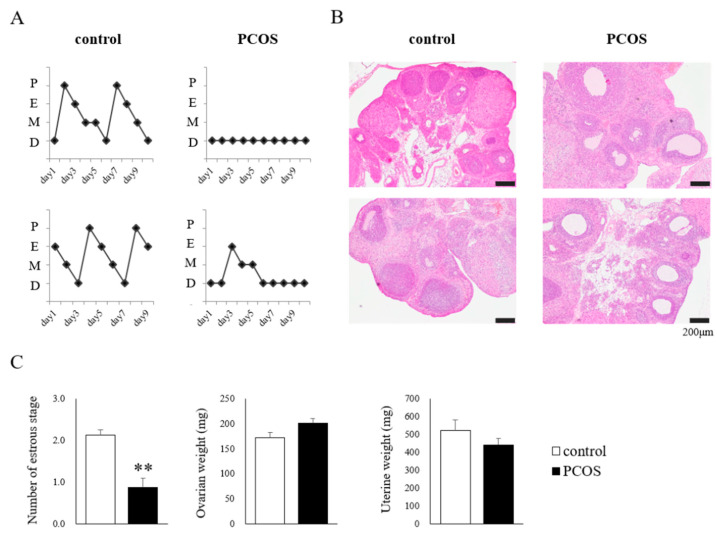
(A) The estrous cycle of two representative rats: D, diestrus; M, metestrus; E, estrus; P, proestrus. (B) Representative ovarian morphology. (C) The number of estrous stages, ovarian weight, and uterine weight in the PCOS (■) and Control (□) groups. Data are expressed as the means ± SEM. ** p < 0.01.

