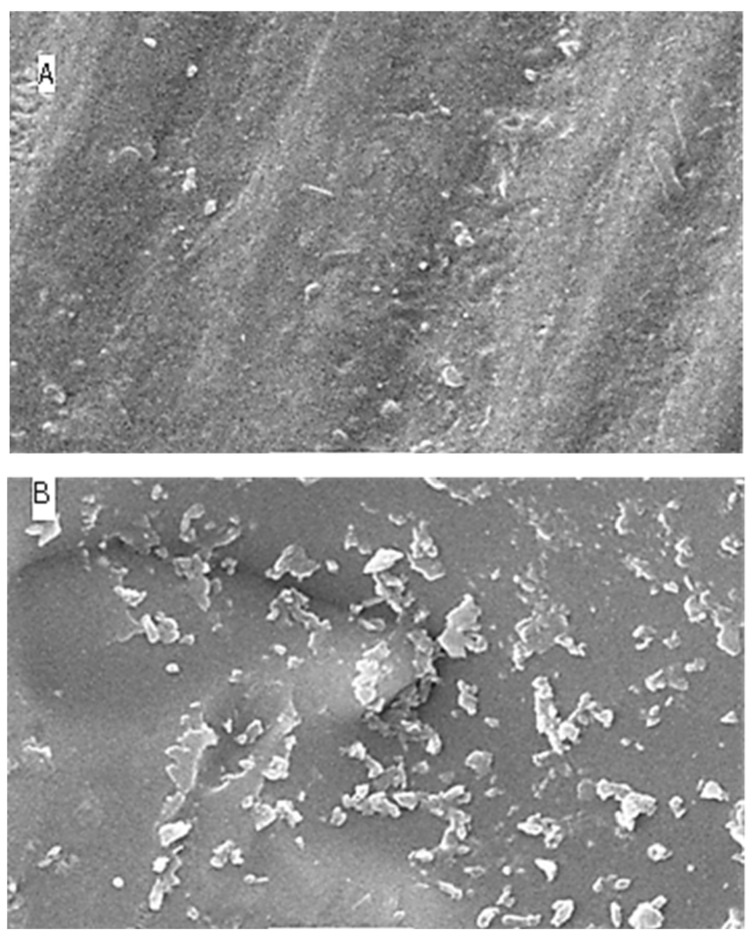
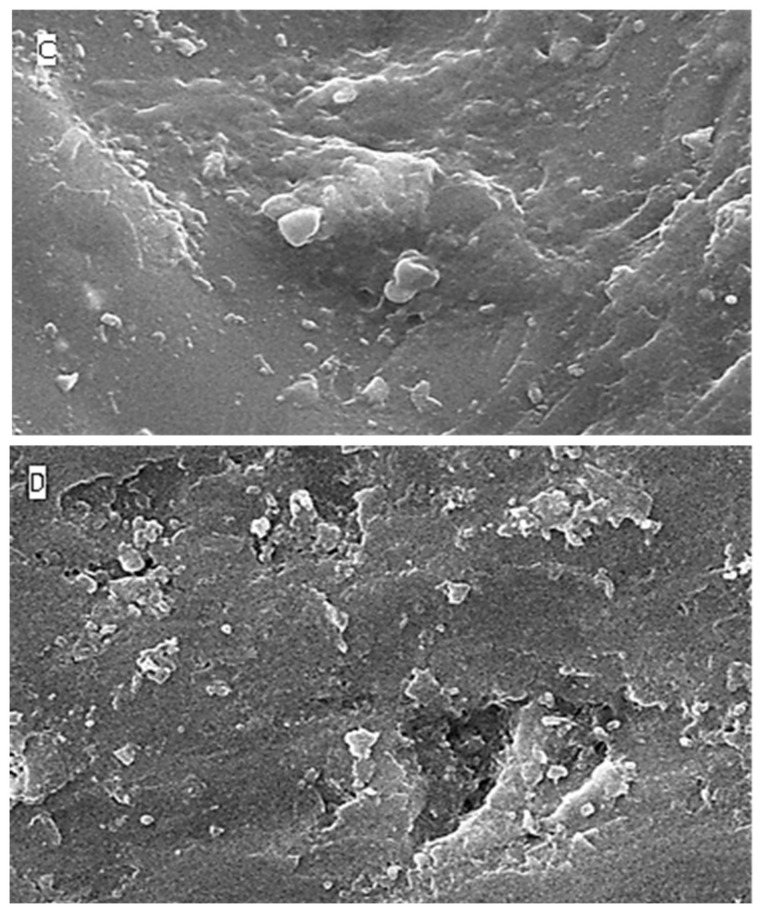
Figure 4.
SEM images (A–D) of surface roughness at baseline, 24 h, 96 h and 168 h in distilled water. (A): Baseline SEM photomicrograph of IPS e.max ceramic before immersion in DW (×5000). (B): SEM photomicrograph of IPS e.max ceramic After 24 h immersion in DW (×5000). (C): SEM photomicrograph of IPS e.max ceramic After 96 h immersion in DW (×5000). (D): SEM photomicrograph of IPS e.max ceramic After 168 h immersion in DW (×5000).


