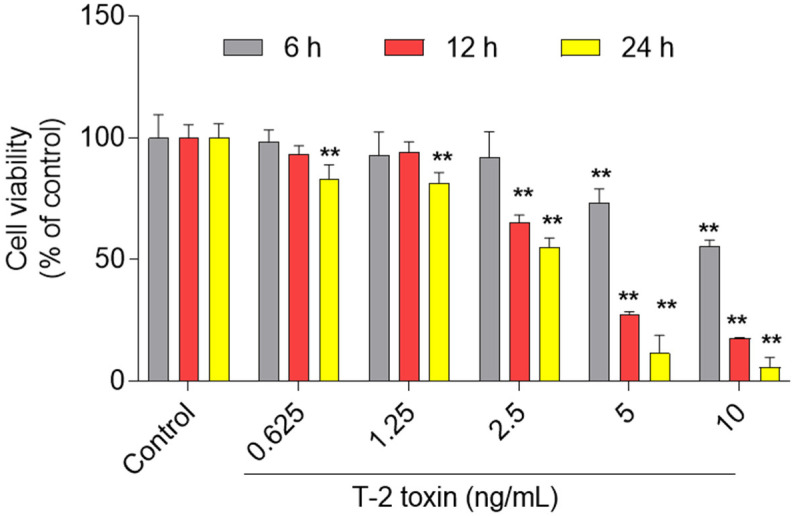
Figure 2.
Cytotoxic effects of T-2 toxin on BV2 cells. BV2 cells were treated with T-2 toxin at the final doses of 0.625, 1.25, 2.5, 5, and 10 ng/mL for 6, 12, and 24 h, respectively; cell viabilities were measured. All data are shown as the mean ± SD from three independent experiments (n = 3). ** p < 0.01, compared to the control group.

