Figure 5.
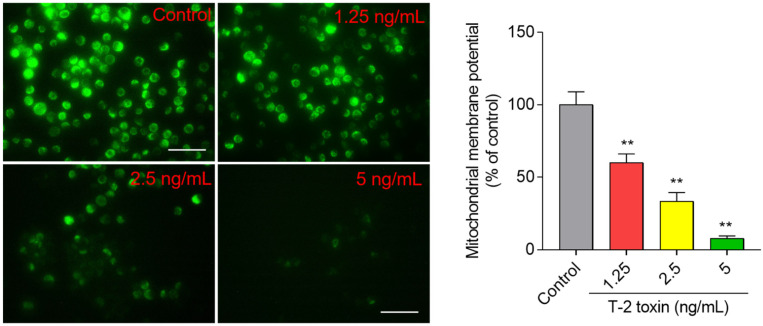
T-2 toxin induces loss of mitochondrial membrane potential in BV2 cells. Cells were treated with T-2 toxin at the final concentrations of 1.25, 2.5, and 5 ng/mL for 24 h, then stained with Rh123 and observed by a fluorescence microscope. The representative images (on the left) were selected and quantitative analysis (on the right) was performed. Bar = 20 μm. Results are presented as mean ± SD from three independent experiments (n = 3). ** p < 0.01, compared to the control.

