Figure 2.
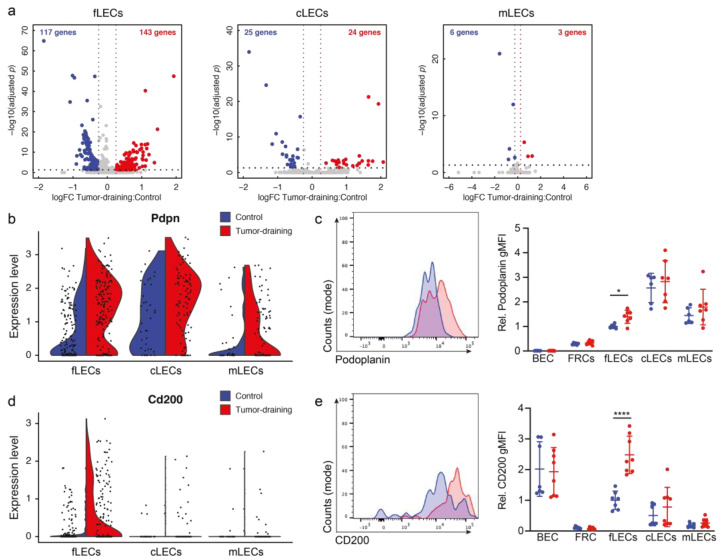
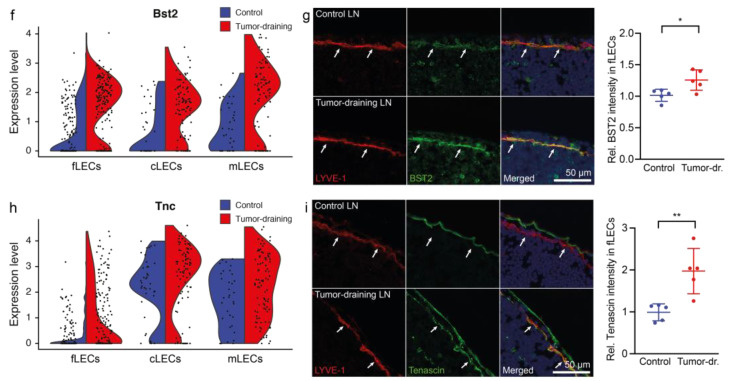
Transcriptional changes in LN LEC subsets in response to tumor growth. (a) Volcano plots showing differentially expressed (DE) genes for LECs of each subset. Significantly up- and downregulated genes and their number are shown in red and blue, respectively. (b) Violin plot of Pdpn expression in LECs from control (blue) and tumor-draining (red) LNs. (c) Representative histogram of podoplanin expression in fLECs (left) and quantification of podoplanin geometric mean fluorescence intensity (gMFI) in blood endothelial cells (BECs), fibroblastic reticular cells (FRCs), and LN LEC subsets in tumor-draining (red) compared with control LNs (blue). gMFI values were normalized to control fLECs in order to pool mice from two individual experiments (N = 6 control/7 tumor-draining). (d) Violin plot of Cd200 expression in LECs from control (blue) and tumor-draining (red) LNs. (e) Representative histogram of CD200 expression in fLECs (left) and quantification of CD200 gMFI in BECs, FRCs, and LN LEC subsets in tumor-draining (red) compared with control LNs (blue). gMFI values were normalized to control fLECs in order to pool data from two individual experiments (N = 7 control/8 tumor-draining). (f) Violin plot of Bst2 expression in LECs from control (blue) and tumor-draining (red) LNs. (g) Representative immunofluorescence staining of LYVE-1 and BST2 in control and tumor-draining LNs and quantification of relative BST2 fluorescence intensity within LYVE-1+ subcapsular sinus (N = 5/group). (h) Violin plot of Tnc expression in LECs from control (blue) and tumor-draining (red) LNs. (i) Representative immunofluorescence staining of LYVE-1 and tenascin in control and tumor-draining LNs and quantification of relative BST2 fluorescence intensity within LYVE-1+ subcapsular sinus (N = 5/group). White arrows indicate the floor of the subcapsular sinus. * p < 0.05, ** p < 0.01, **** p < 0.0001, unpaired t-test.


