Figure 3.
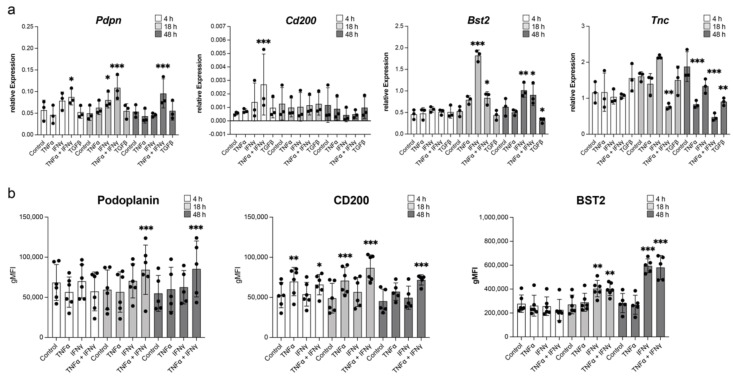
Induction of selected genes in primary LN LECs by cytokines. (a) Induction of Pdpn, Cd200, Bst2, and Tnc expression in LN LECs treated with cytokines for 4 h (white), 18 h (light-gray), or 48 h (dark-gray) measured by qPCR. Pooled data from three experiments, presented as relative expression normalized to Rplp0 at each time point. Individual values, mean, and SD are shown. (b) Induction of podoplanin, CD200, and BST2 in LN LECs treated with cytokines for 4 h (white), 18 h (light-gray), or 48 h (dark-gray) measured by flow cytometry. Pooled data from six experiments, gMFI of each sample, mean, and SD are shown. * p < 0.05, ** p < 0.01, *** p < 0.001, RM one-way ANOVA with Geisser–Greenhouse correction and Dunnett’s multiple comparisons test comparing the means of each time-point to the respective control.

