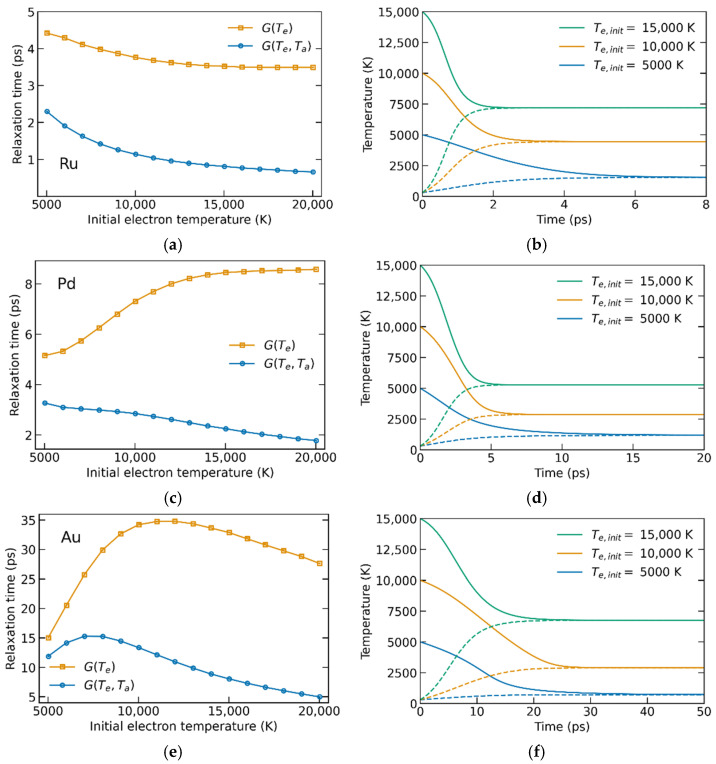
Figure 4.
(a,c,e) Electron–ion relaxation times, calculated using both electronic- and atomic-temperature-dependent coupling (blue) and only electronic-temperature-dependent coupling (orange). (b,d,f) Examples of Te- and Ta-profiles calculated using G(Te,Ta) for different starting electronic temperatures; solid lines are the electronic temperatures, and dashed lines are the ionic ones. (a,b) correspond to Ru, (c,d) to Pd, (e,f) to Au.

