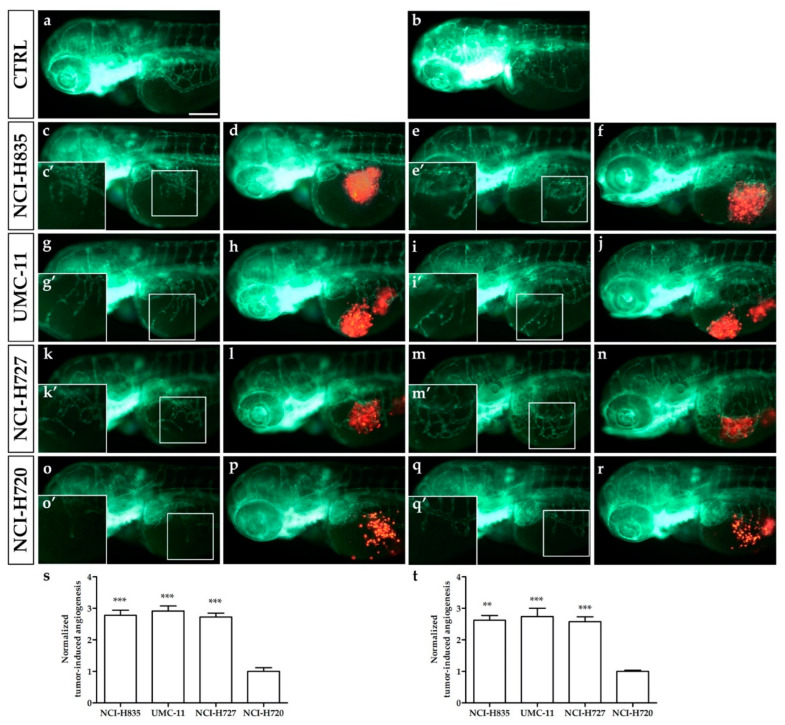
Figure 1.
Engraftment of lung carcinoid cells in zebrafish embryos. Representative epifluorescence images of Tg(fli1a:EGFP)y1 embryos injected with cell resuspension solution (control: a,b) and implanted with red-stained NCI-H835, UMC-11, NCI-H727, and NCI-H720 cells (c–r). Embryos were imaged at 24 (a,c,d,g,h,k,l,o,p) and 48 (b,e,f,i,j,m,n,q,r) hpi. The red channel was omitted in panels (c,e,g,i,k,m,o,q) to facilitate the observation of tumor-induced angiogenesis (green). (c′,e′,g′,i′,k′,m′,o′,q′) are the digital magnifications of white-boxed regions. The graphs showed the quantification of tumor-induced angiogenesis in embryos implanted with lung carcinoid cells after 24 (s) and 48 (t) hpi. NCI-H720 values have been set to 1.0. Graphed values represent the mean ± S.E.M. ** p < 0.01 vs. NCI-H720; *** p < 0.001 vs. NCI-H720. All implanted cells stimulated endothelial sprouting from the SIV plexus within 24 hpi. Embryos are shown anterior to the left. Scale bar: 100 µm.

