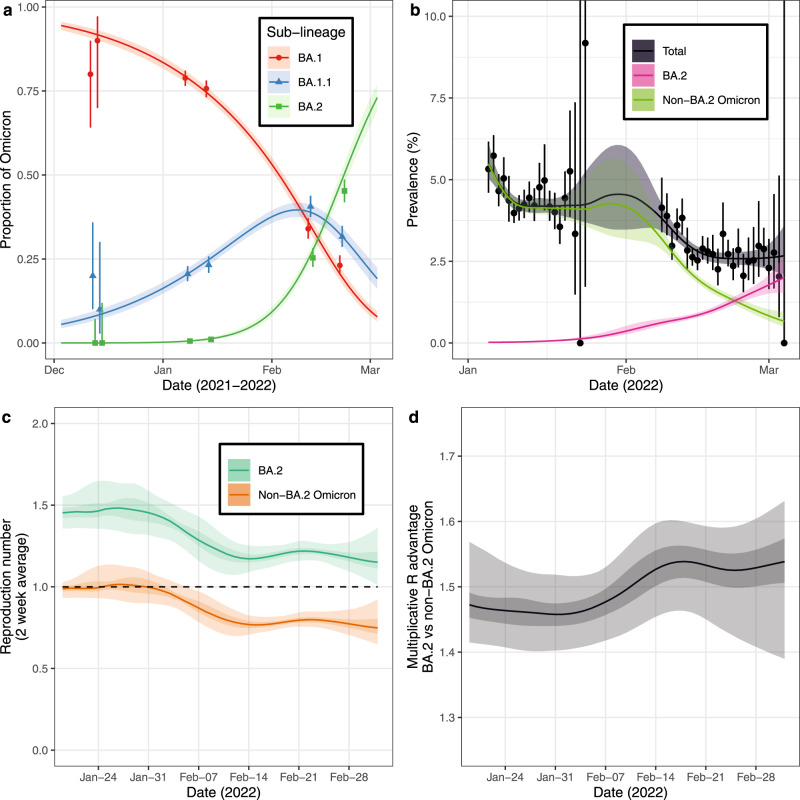
Fig. 3. Dynamics of Omicron sub-lineages.
a Modelled proportion of Omicron lineages that are BA.1, BA.1.1 and BA.2, estimated for using a Bayesian multinomial logistic regression model. Estimates of proportion are shown with a central estimate (solid line) and 95% (shaded region) credible intervals. Point estimates of mean proportion (points) are shown with 95% confidence intervals (error bars) for each half round of REACT-1 with x-axis value set by the median date (jittered for all lineages for visualisation). b Modelled prevalence of BA.2 and non-BA.2 Omicron in England estimated using a mixed-effects Bayesian P-spline model. Estimates of prevalence are shown with a central estimate (solid line) and 95% (shaded region) credible intervals. Daily weighted estimates of mean prevalence (points) are shown with 95% credible intervals (error bars). c Rolling two-week average (prior two weeks) Reproduction number for BA.2 and non-BA.2 Omicron in England as inferred from the mixed-effects Bayesian P-spline model. Estimates are shown with a central estimate (solid line) and 50% (dark shaded region) and 95% (light shaded region) credible intervals. Dashed line shows R = 1 the threshold for epidemic growth. d Multiplicative advantage in the two-week average reproduction number for BA.2 vs non-BA.2 Omicron in England as inferred from the mixed-effects Bayesian P-spline model. Estimates are shown with a central estimate (solid line) and 50% (dark shaded region) and 95% (light shaded region) credible intervals.

