
Fig. 10.
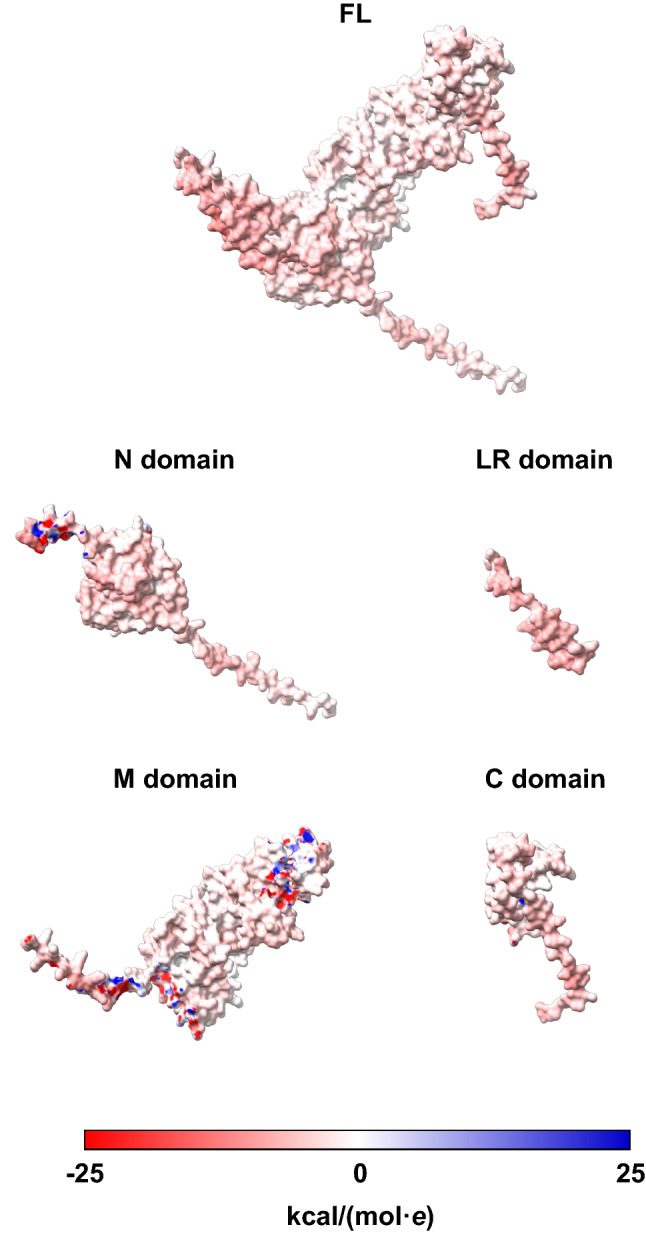
Electrostatic potential distributions on the surfaces of FL-HSP90 and its four domains. The models were constructed by UCSF ChimeraX software (version 1.3) (https://www.rbvi.ucsf.edu/chimerax) using 3D structure of HSP90 available in AlphaFold protein structure database (https://alphafold.ebi.ac.uk) as a template. The electrostatic potentials of FL-HSP90 and its four domains were auto-calculated according to Coulomb's law. Red color indicates negatively charged, whereas blue indicates positively charged distributions at the range of − 25 to + 25 kcal/(mol·e). Additional details are reported in Table 3