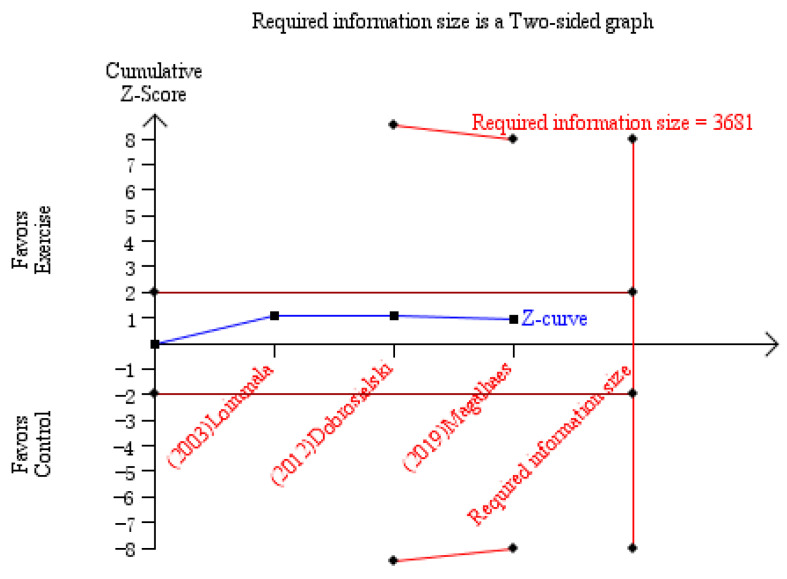
Figure 4.
The result of TSA for PWV. TSA showed that the pooled results did not (z-curve, blue curve) crossed the conventional boundary of benefit (brown line) or the trial sequential monitoring boundary for benefit (upper red line), and did not reach the required sample size based on TSA (n = 3681) [35,37,38].

