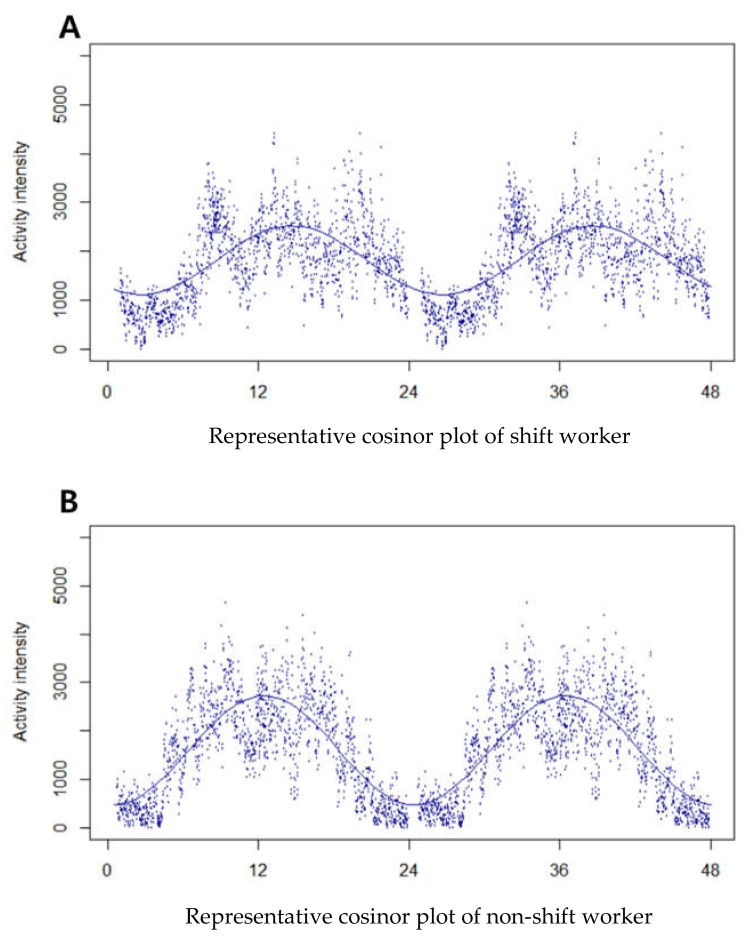
Figure 3.
Representative cosinor plots of shift and non-shift worker. Activity intensity means vector magnitude values of activity recorded by actigraph. ID indicates phase (acrophase), and the x-axis is responding time. (A) A double plot of averaged 24-h activity rhythm with the fitted curve of shift worker 002. (B) A double plot of averaged 24-h activity rhythm with the fitted curve of non-shift worker 012.

