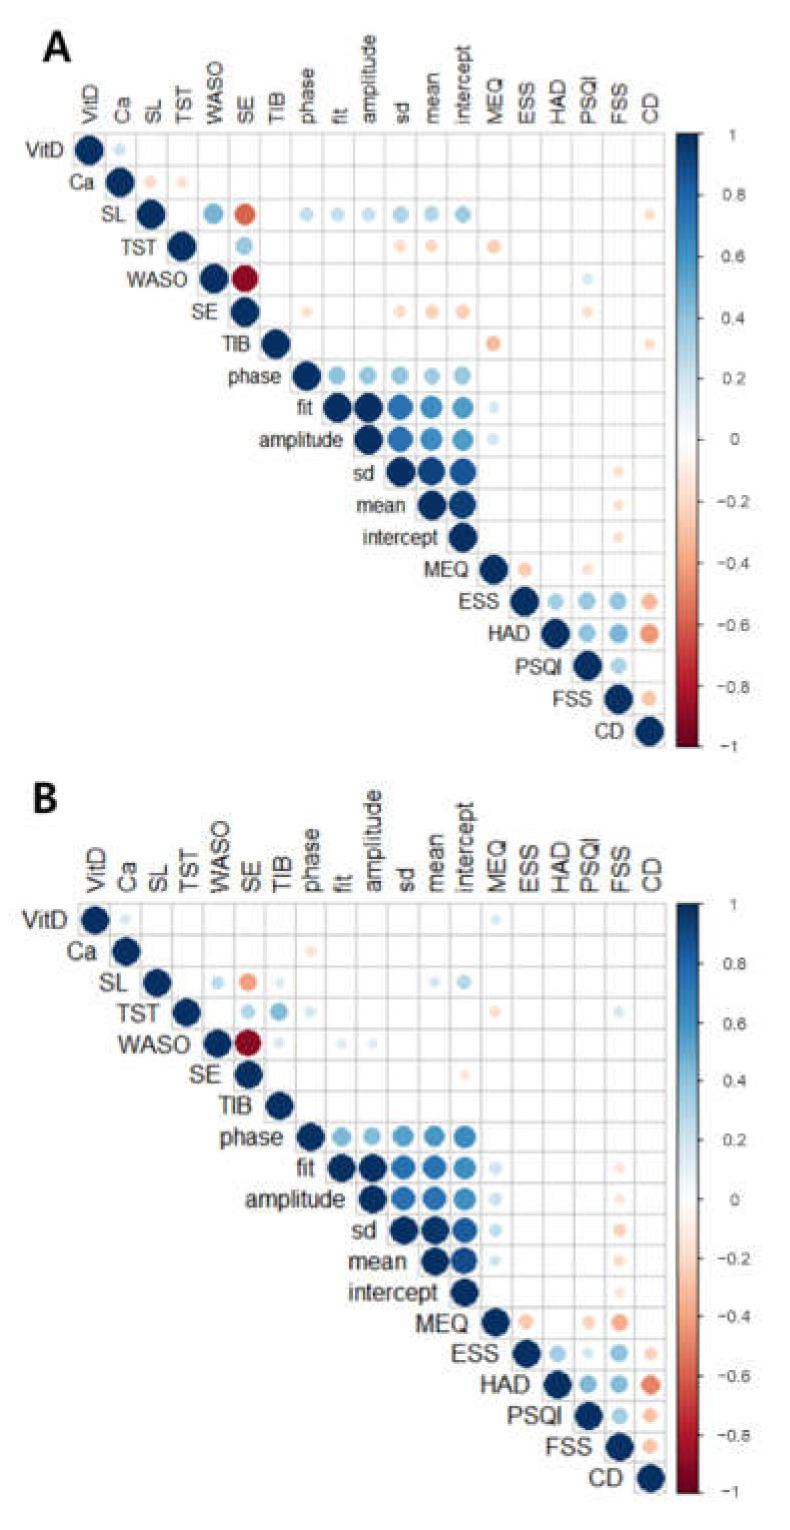
Figure 4.
Correlation plots of each parameter from shift and non-shift workers. (A) Correlation plot of shift workers (n = 150) and (B) correlation plot of non-shift workers (n = 203). Only a statistically significant correlation (p < 0.05) is shown in these plots. The color and size of each circle reflect the value of Pearson’s correlation coefficient r (blue: positive and red: negative).

