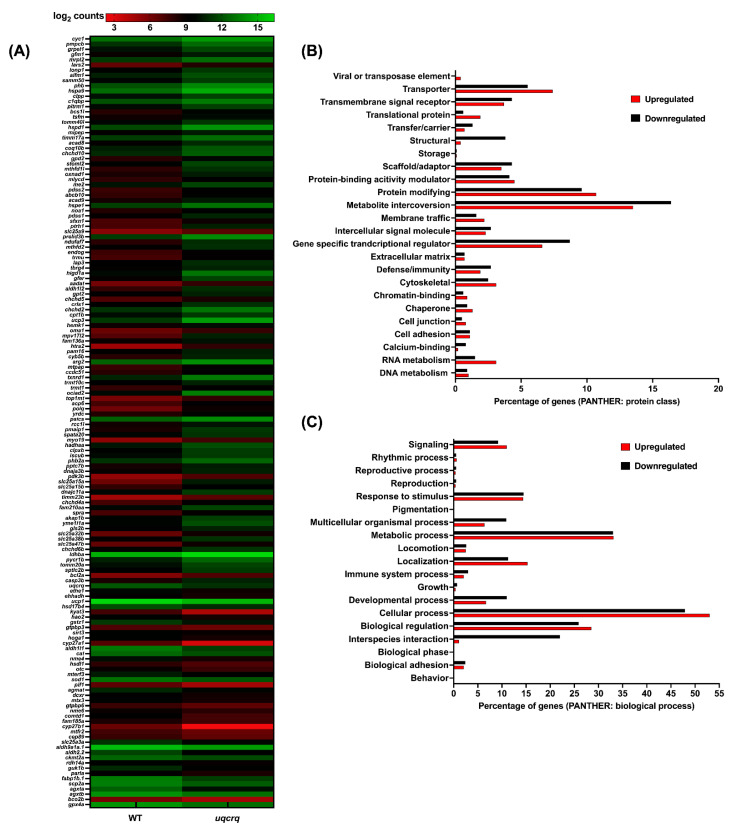
Figure 5.
RNAseq analysis of uqcrq mutants: (A): Differential expression of zebrafish orthologs for human mitochondrial resident proteins; MitoCarta is represented as a heat map. The gradient color scale represents the log2CPM value obtained for each of the zebrafish mitochondrial orthologs in the two datasets. (B,C): Differentially expressed genes classified according to protein class (B) and biological processes (C). Each histogram represents the percentage of genes falling in each of the categories.

