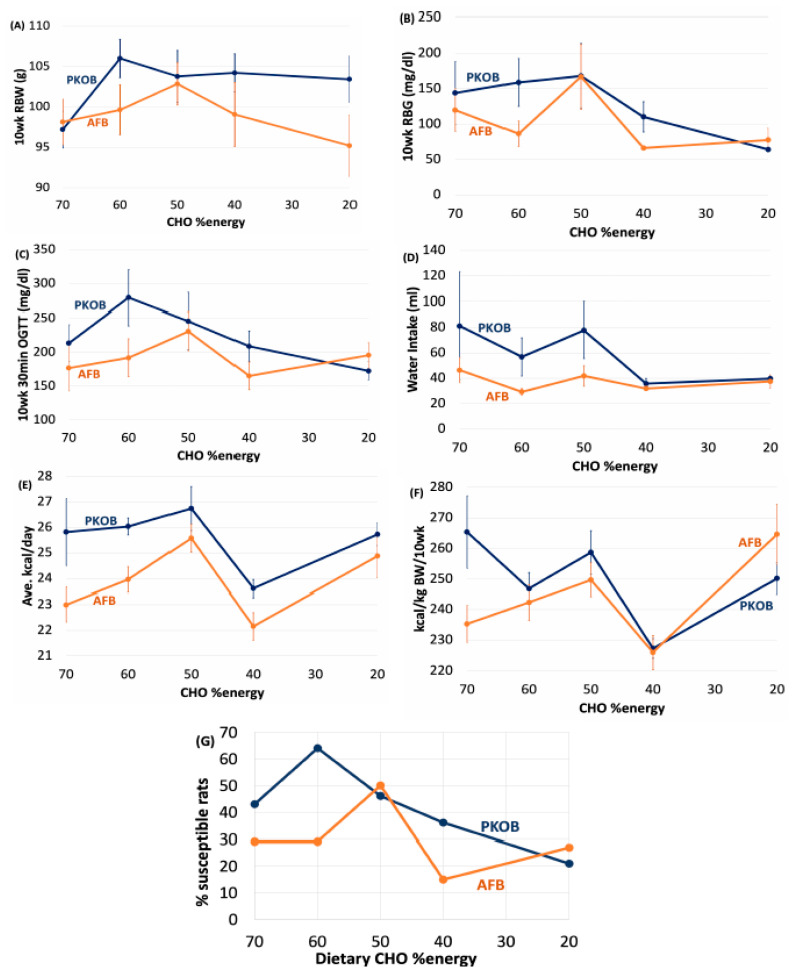
Figure 1.
Clinical results for diabetes induction are depicted for all Nile rats (n = 14 rats per CHO:fat ratio) based on the dietary CHO %energy designated on the X-axis starting at 70, 60, 50, 40, and 20% energy with corresponding fat increments at 10, 20, 30, 40 and 60% fat energy, respectively, for PKOB (blue) and AFB (orange). (A) PKOB tended to produce greater RBWs than AFB. (B) RBG revealed more diabetes with PKOB, i.e., 42% of rats for PKOB vs. 29% for the AFB. (C) The 30′ OGTT confirmed that diabetes was more severe with PKOB than AFB, especially at the two highest intakes of CHO. (D) Water consumption was greater for rats fed PKOB than AFB, but only for the 3 highest intakes of CHO at 70, 60, and 50% energy linked to diabetes severity. (E) Kcal/day was generally higher for PKOB and significant at 70 and 60 CHO %energy. (F) Once adjusted for BW, kcal/day was similar for all CHO intakes for both fats, except for 70% energy from CHO, where PKOB was greater than AFB. (G) PKOB induced a greater percentage of susceptible rats at 70, 60, and 40 CHO %energy, reflecting the greater extent of diabetes for PKOB (45% more) than AFB in general, as depicted in (B) above. The AFB with 50% energy from CHO also induced unique peaks in terms of RBG and %susceptible rats. In summary, these clinical data indicate that PKOB rats weighed more, consumed more calories and drank more water, with the most diabetes. This occurred at the 3 greatest hiCHO intakes for both fat types (see Tables S3 and S4 for details).

