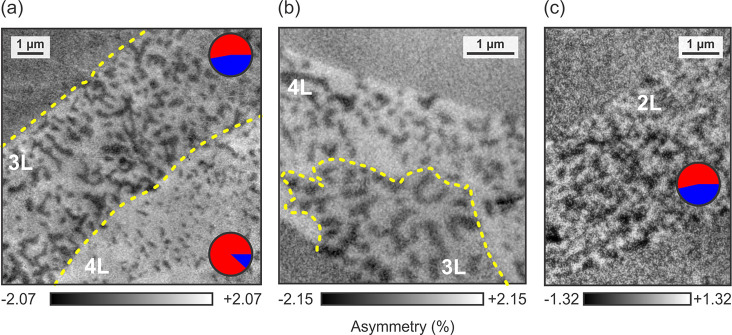
Figure 3.
Layer-dependent magnetic domain structures. The images obtained for (a,b) 4L and 3L, and (c) 2L flakes, show a strong dependence on Fe5GeTe2 thickness (T = 50 K). The distribution of up (red) and down (blue) domains for each thickness are indicated in (a) and (c). The 4L area shows interdispersed isolated bubbles, which are dominating the domain contrast further away from the edge of the flake. The 3L area shows elongated domains, as well as a smaller density of interdispersed isolated bubbles. The 2L flake shows a lower magnetic signal and exhibits a highly fragmented domain state. The boundaries between the nL flakes are indicated by dashed yellow lines. They were obtained from the XAS maps (example shown in Figure S6). Note that the panels have different asymmetry scales.

