
Figure 4. GUIDE-seq example output.
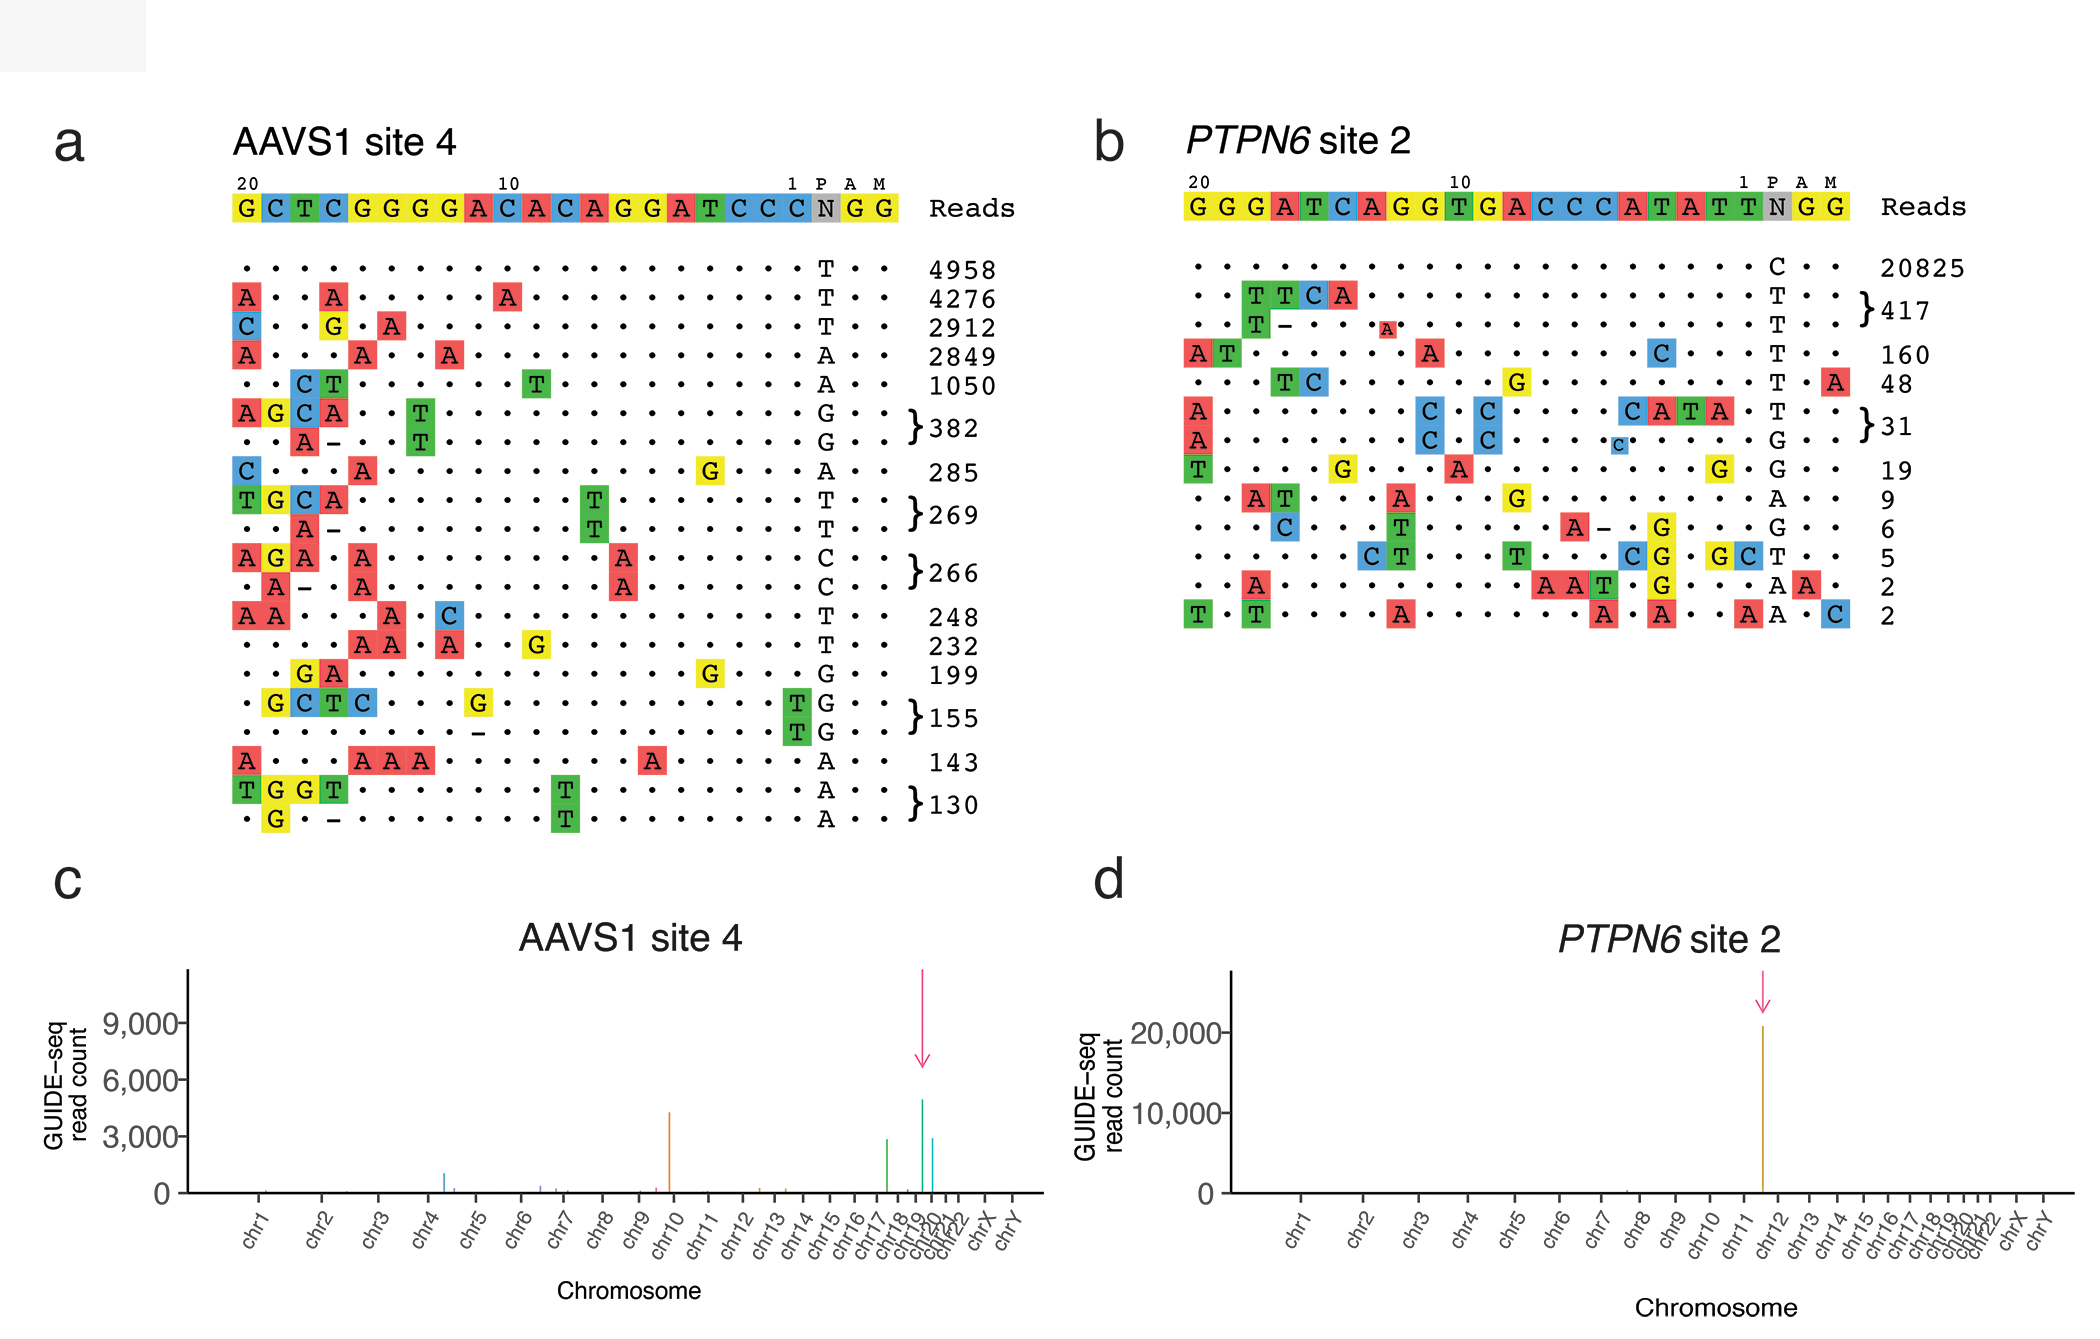
GUIDE-seq on-target and off-target detailed visualizations are shown from previously published experiments7 (a) low-specificity gRNA targeting AAVS1 site 4, (b) high-specificity gRNA targeting PTPN6 site 2. Each row represents an on-target or off-target site and GUIDE-seq read counts corresponding to that site are shown to the right. A dot represents matches with respect to the intended target sequence, and colored nucleotides indicate the sequence of mismatches. Visualizations are ordered by GUIDE-seq read counts. Manhattan plots for (c) AAVS1 site 4 and (d) PTPN6 corresponding to the same GUIDE-seq data are shown; x-axis represents chromosomal location and y-axis represents GUIDE-seq read counts. Original figure.