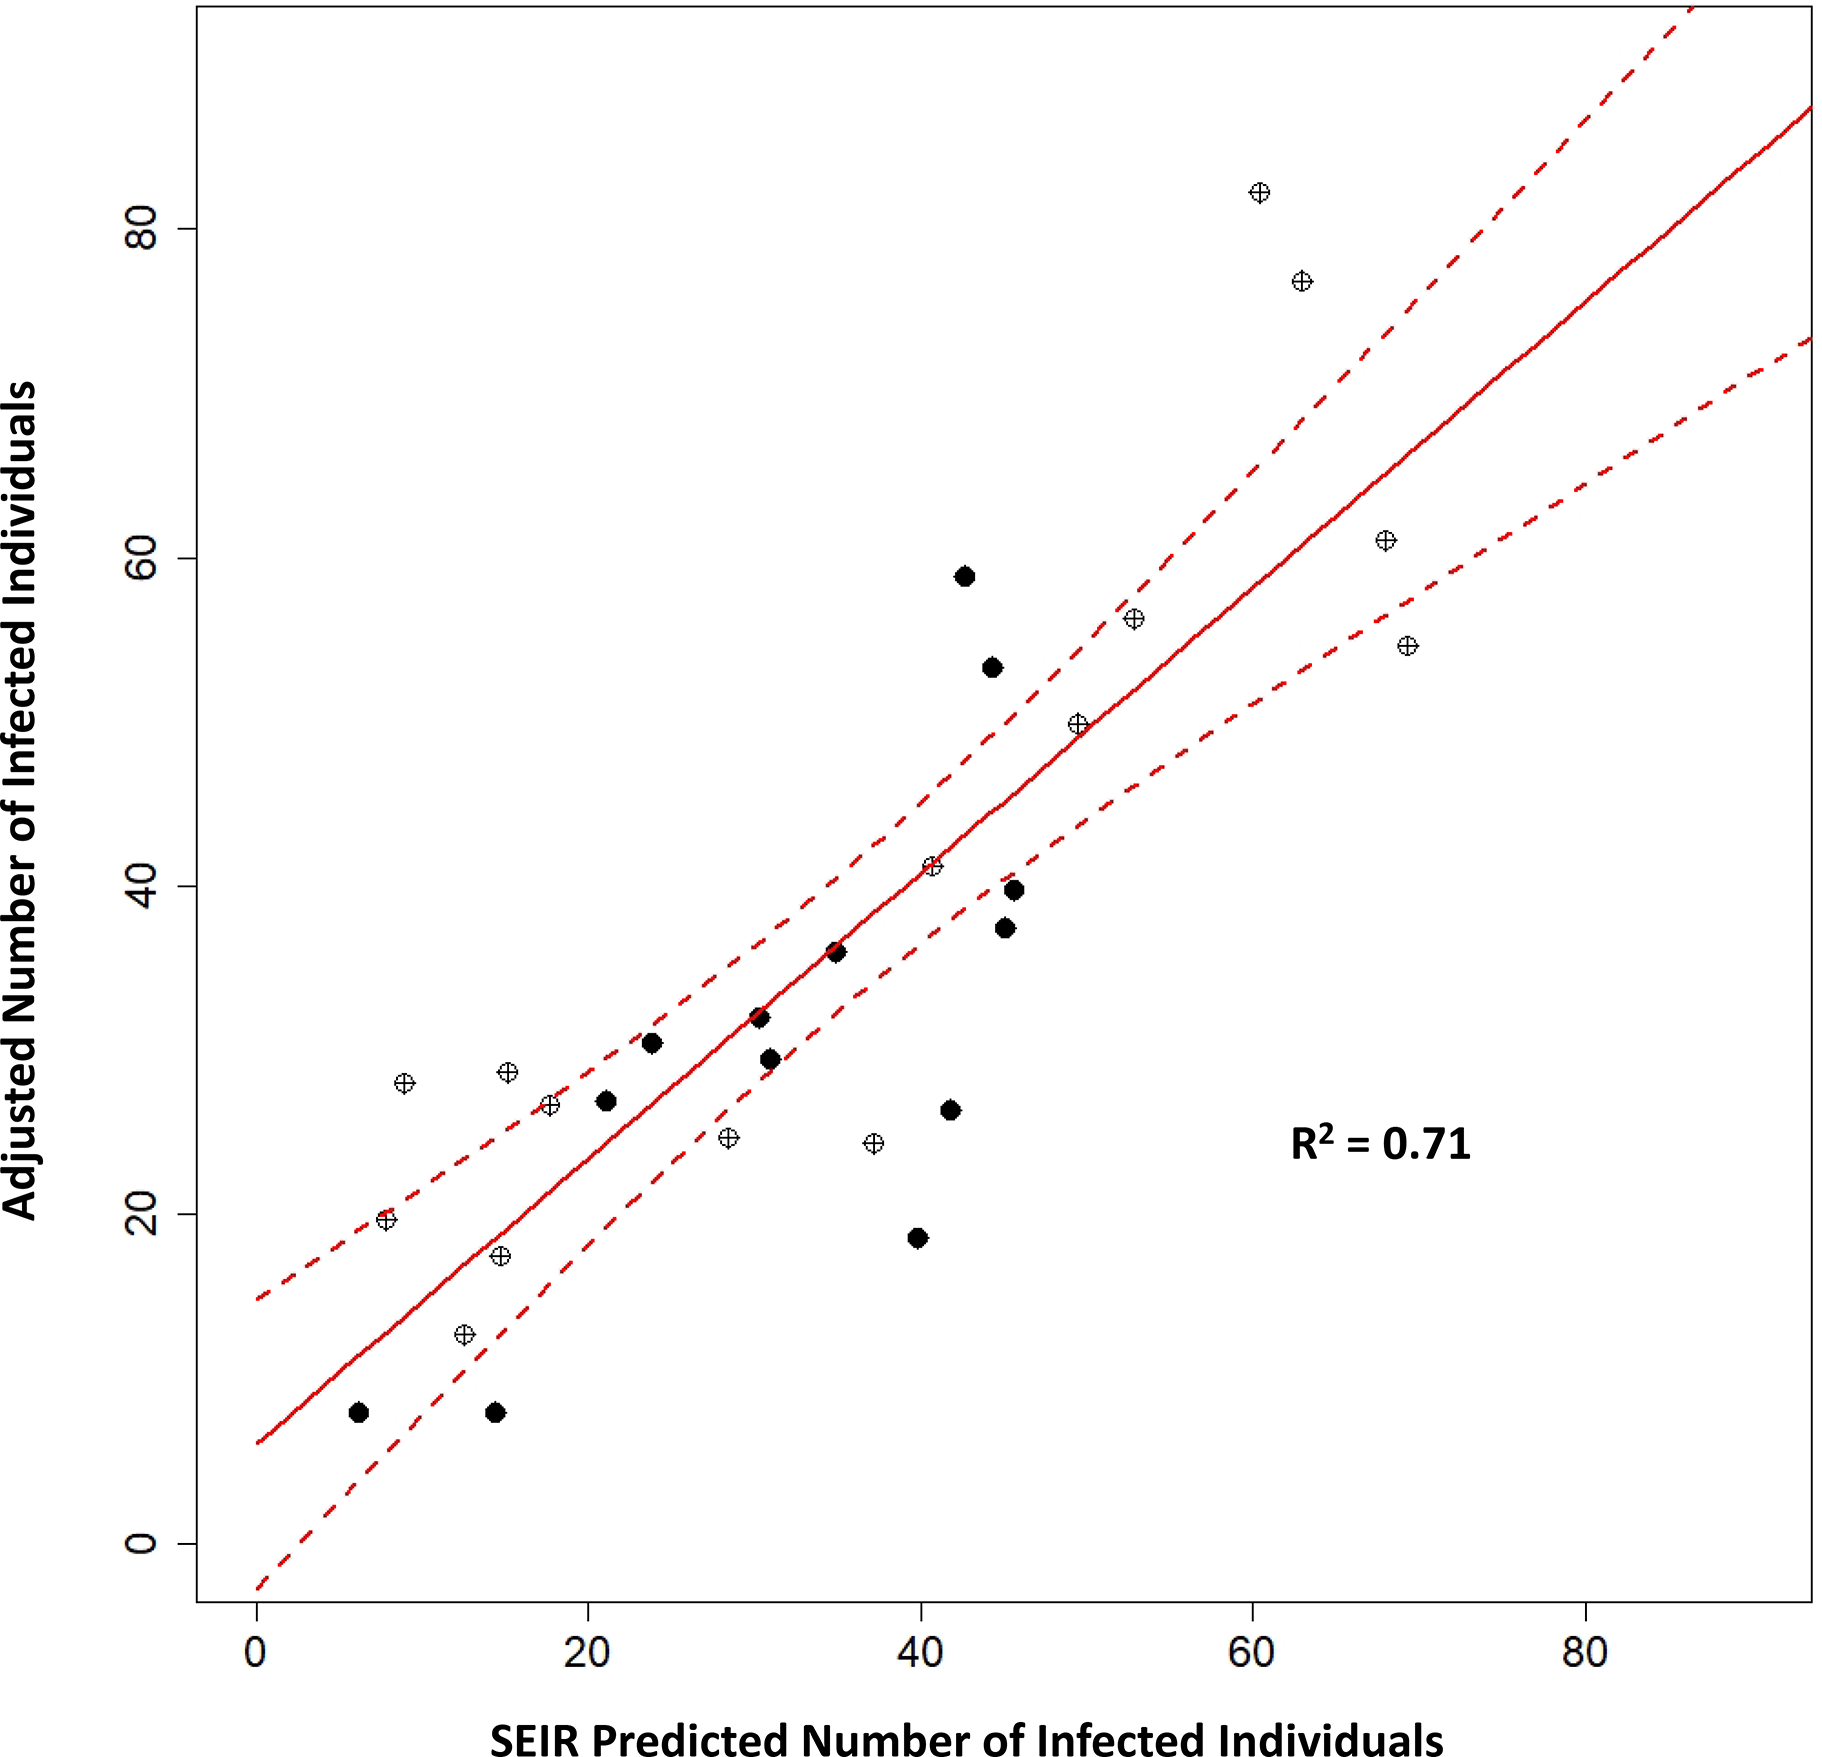
Figure 3.

Regression model for the adjusted saliva-test-positive number of infected individuals versus the predicted number of infected individuals based on the SEIR model, using the smoothed wastewater RNA mass rate data. Open circles are for sampling events when the Alpha and Beta/Gamma variants were not detected; filled circles represent samples when one of the variants comprised at least 25% of the total virus concentration. The red line is the best fit and the dashed lines are the 95% confidence intervals.
