FIGURE 13.

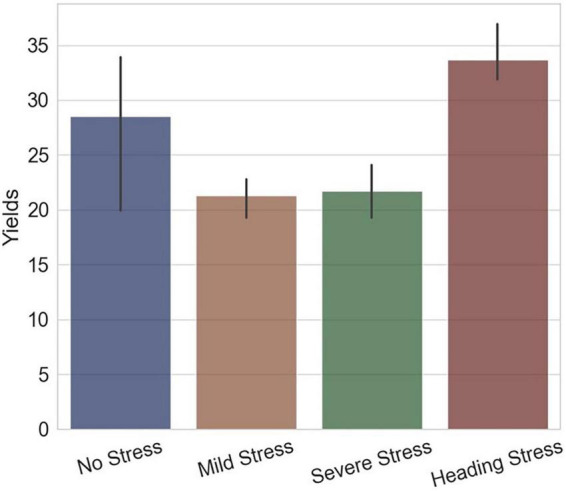
The final yields of experimental groups of different water treatments, the x-axis represents the groups and the y-axis represents the yields (g per plant).

The final yields of experimental groups of different water treatments, the x-axis represents the groups and the y-axis represents the yields (g per plant).