
FIGURE 13.
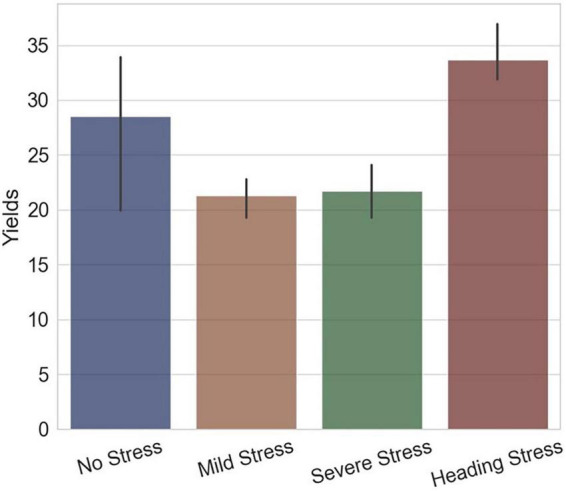
The final yields of experimental groups of different water treatments, the x-axis represents the groups and the y-axis represents the yields (g per plant).
Official websites use .gov
A
.gov website belongs to an official
government organization in the United States.
Secure .gov websites use HTTPS
A lock (
) or https:// means you've safely
connected to the .gov website. Share sensitive
information only on official, secure websites.
The final yields of experimental groups of different water treatments, the x-axis represents the groups and the y-axis represents the yields (g per plant).