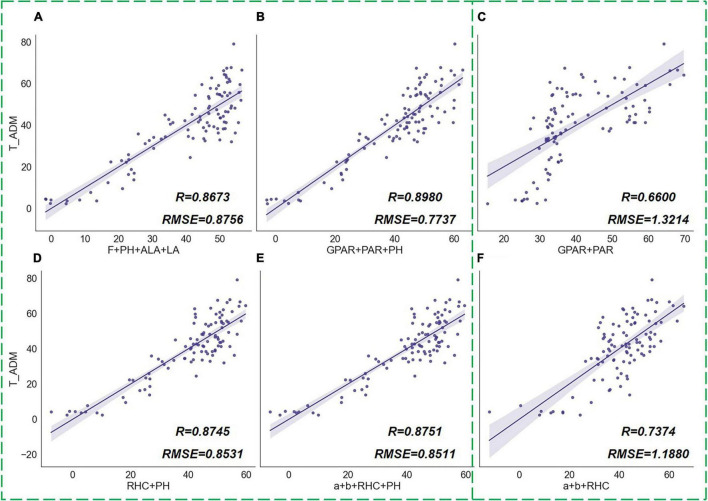
FIGURE 14.
MLR results of phenotypic traits groups and above-ground dry matter of rice (ADM). The scatter graphs show the Pearson correlation test results between the regression values and the true measurement values. The x-axis represents the ADM values derived from the regression model, and the y-axis represents the measured ADM values. Different combinations of traits are (A) [F, PH, ALA, LA], (B) [GPAR, PAR, PH], (C) [GPAR, PAR], (D) [RHC, PH], (E) [a, b, RHC, PH], (F) [a, b, RHC].

