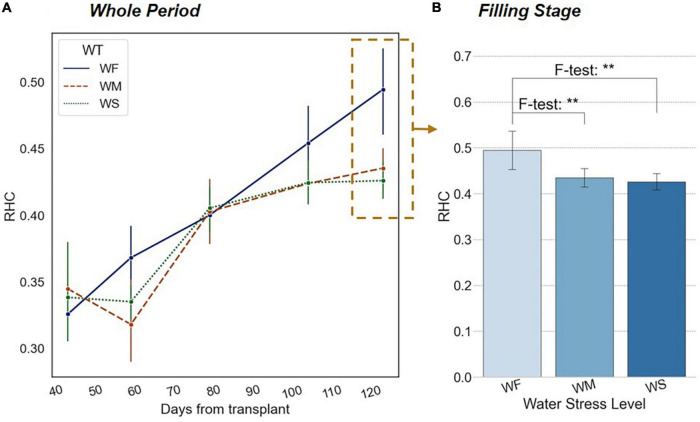
FIGURE 6.
(A) Trends of RHC in different long-term water treatment groups during the whole growth period. (B) Significant differences in RHC among three water treatment groups at the filling stage. The x-axis represents water treatment groups. The blue bars indicate the value of RHC. The number of asterisk (*) represents the degree of the significance (p-value of < 0.05 *, p-value of < 0.01 **, and p-value of < 0.001 ***).

