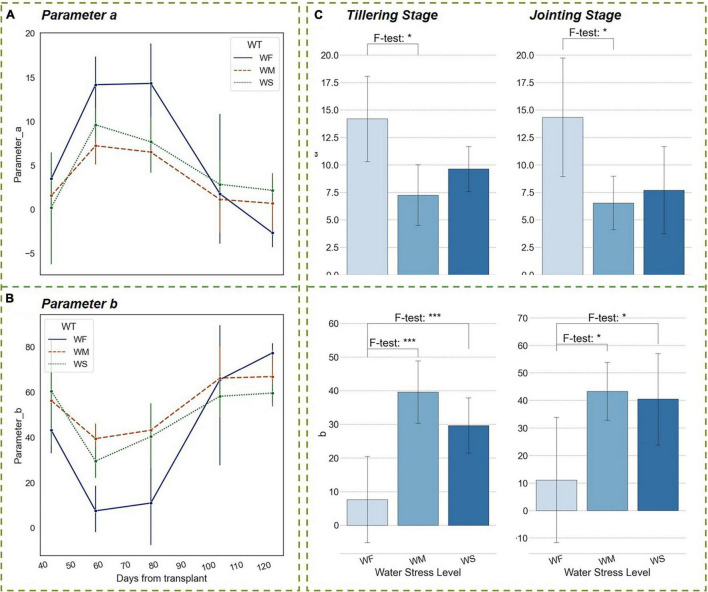
FIGURE 7.
Trends of parameters of the vertical distribution function in different water treatment groups during the whole growth period. (A) Parameter a, (B) Parameter b. (C) Significant differences in parameters among three water treatment groups at the tillering and jointing stages. The blue bars indicate the value of parameter a or b. The number of asterisk (*) represents the degree of the significance (p-value of < 0.05 *, p-value of < 0.01 **, and p-value of < 0.001 ***).

