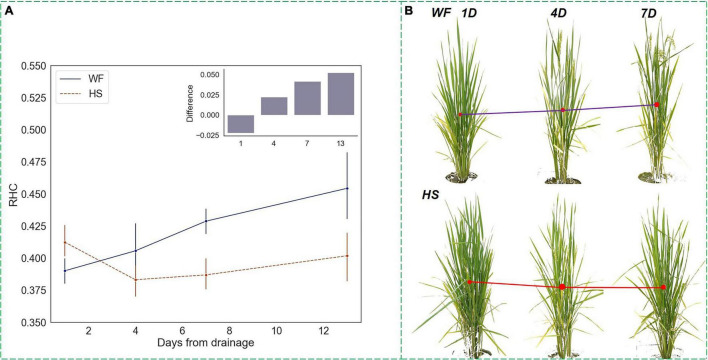
FIGURE 8.
Changing trends of RHC under short-term water stress at the heading stage. (A) RHC trends and differences. (B) Changes in the front-view images of rice 7 days after drought. The blue line (upper) represents the RHC of plants in the WF group, while the red line (lower) represents the RHC of plants in the HS group. The y-axis of the histogram represents the difference between RHC of the WF group minus that of the HS group.

