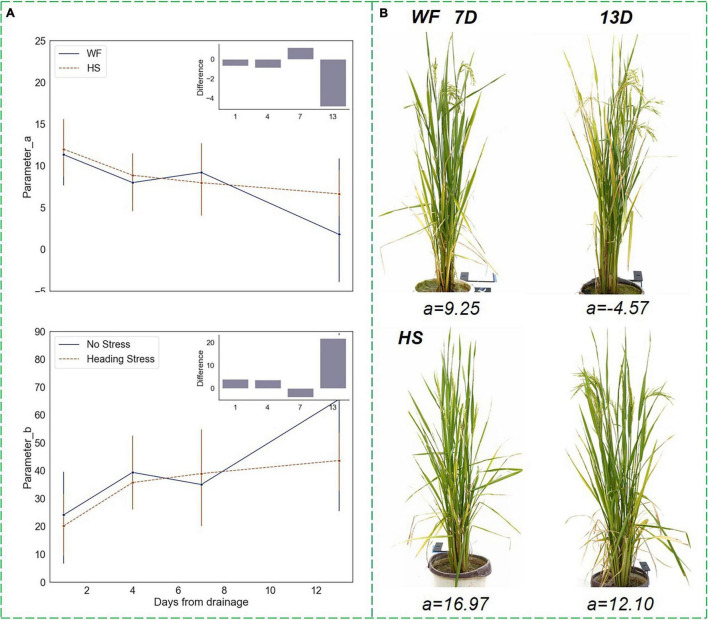
FIGURE 9.
Changing trends of parameters in the vertical distribution function under short-term water stress during the heading stage. (A) Parameters a and b trends. (B) Changes in the front-view image within 7–13 days after drought, where the upper images showed the plants in the WF group, and the lower images showed the plants in the HS group.

