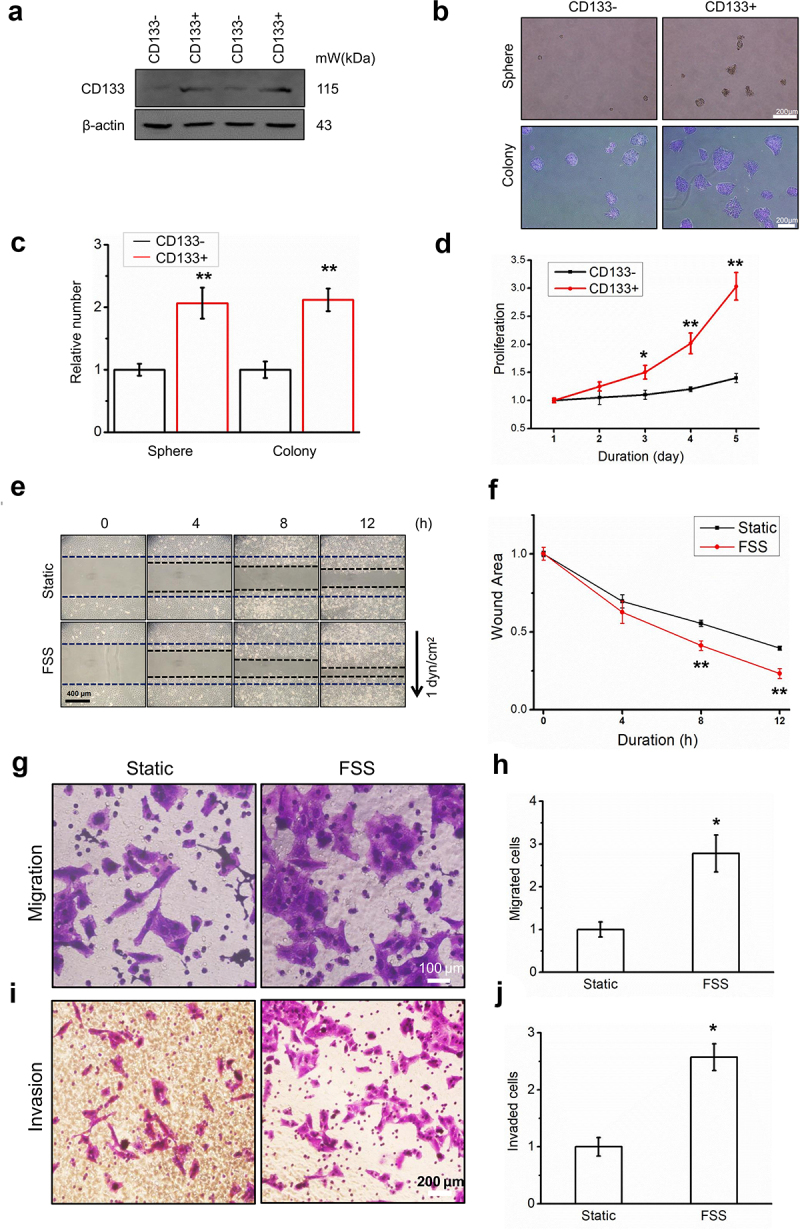
Figure 1.

FSS promoted the migration of LCSCs. (a) Huh7 was sorted by CD133 positive magnetic beads, and the CD133 protein expression of the sorted cells was analyzed by Western blot. (b-c) Spheroid and colony formation assay of CD133- and CD133+ Huh7 cells. Scale bar = 200 μm. Relative number of cell spheres and clone formation. (d) Cell proliferation of CD133- and CD133+ Huh7 cells was detected by CCK8. (e-f) Migration of LCSCs in static and FSS group (1 dyn/cm2) was detected by wound healing assay. The arrow indicates the direction of FSS. Scale bar = 400 μm. (g-j) Migration and invasion of LCSCs in static and FSS group (1 dyn/cm2) was detected by Transwell assay. Scale bar = 100 or 200 μm. Results are shown as means ± SD (n = 3). Data is expressed as the median with interquartile range; Data obtained from different treatment groups were statistically compared with one-way ANOVA followed by Tukey’s test. *P < 0.05, compared with control. **P < 0.01, compared with control.
