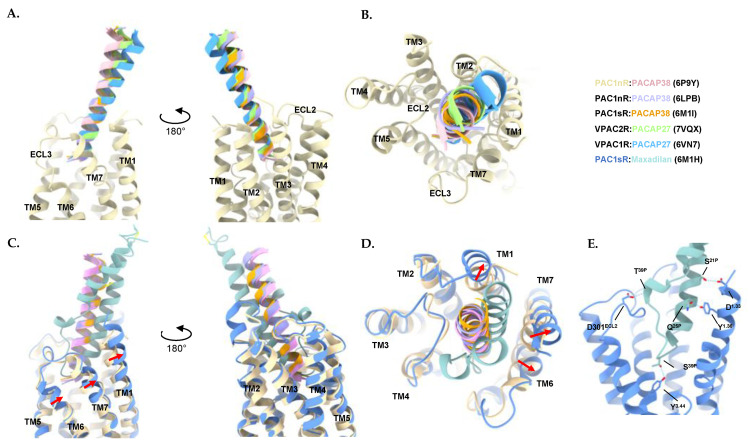
Figure 4.
Comparison of peptide binding mode to receptors of the PACAP subfamily. (A) Side views and (B) Top view of the superimposed structures of PACAP bound to VPAC1R, VPAC2R, and PAC1R. Only the transmembrane (TM) helices of the receptor chain of PAC1nR (PDB: 6P9Y) are shown for reference/clarity. (C) Side views and (D) Top view of the superimposed structures of maxadilan and PACAP bound to PAC1R reveals TM1, 6, and 7 shifted outward to accommodate maxadilan (PDB: 6M1H) when compared to the PACAP38-bound PAC1nR (PDB: 6P9Y). Movement of the TMs indicated by red arrows. Only the TM helices of the receptor chain of the PACAP38-bound PAC1nR (PDB: 6P9Y) and the TM helices of the receptor chain for the maxadilan-bound PAC1sR (PDB: 6M1H) are shown for reference/clarity. (E) Helix 1 of maxadilan forms hydrogen bonds with TM1 in the peptide binding pocket while the loop of maxadilan and helix 2 forms hydrogen bonds with ECL2 and TM3. Structure is shown as a side view with a focus on the receptor core. Hydrogen bonds calculated with ChimeraX 1.3. Structures were aligned by receptor chains and displayed as ribbons, with residues involved in hydrogen bonds (dotted lines) shown as sticks using ChimeraX 1.3 [310,311]. Colors for the peptides and receptors are shown in the figure. Peptide residues are denoted with superscript P, extracellular loop residues are denoted as ECL. Receptor transmembrane residues are denoted using the Wootten numbering system.

