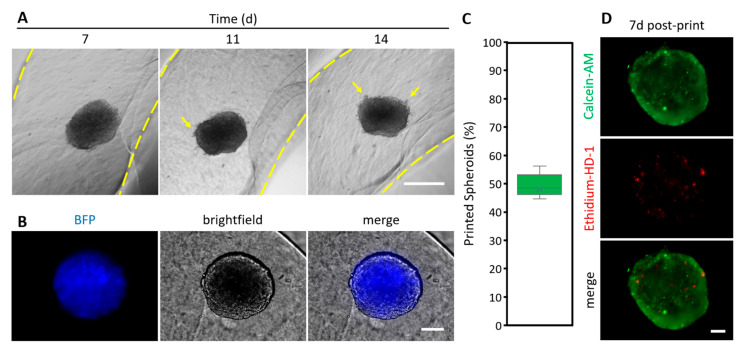
Figure 8.
Printed spheroids in CANAHA bioink. (A) Time course of A549-BFP spheroid culture (yellow arrows indicate outgrowth of cells; space in yellow dashed lines indicates printed gel), scale bar 1000 µm. (B) Fluorescence microscopy image of A549-BFP spheroid 7 d after printing, scale bar 100 µm. (C) Rate of printed spheroids, n = 7 prints with 780 spheroids in total. (D) Calcein-AM and ethidium-HD-1 staining (live and dead assay) of bioprinted A549 spheroids 7 d after printing, scale bar 100 µm.

