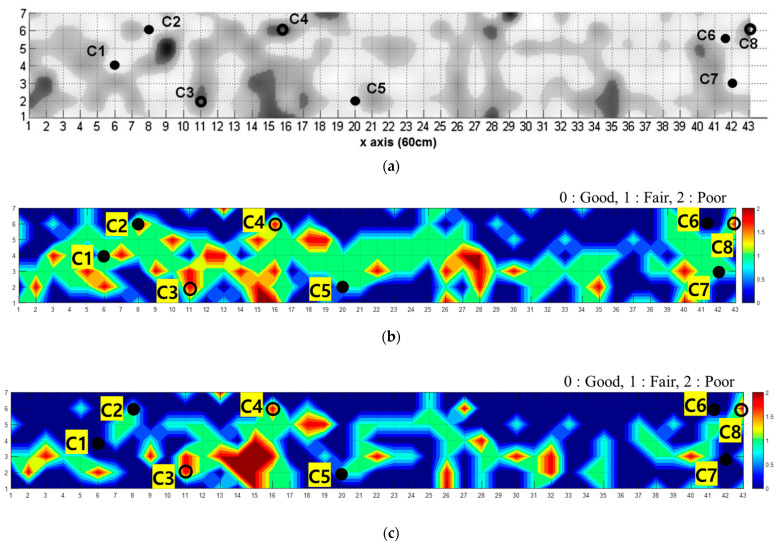
Figure 13.
C-scan images for IE data collected from the bridge deck; spectral data are displayed up to 6 kHz. The closed and open circles are the positions of the good and poor cores, respectively. (a) Overlapped images of four NDT results analyzed by experts (image courtesy: Taekeun Oh), (b) prediction result of the SL model, (c) prediction result of the SSL model.

