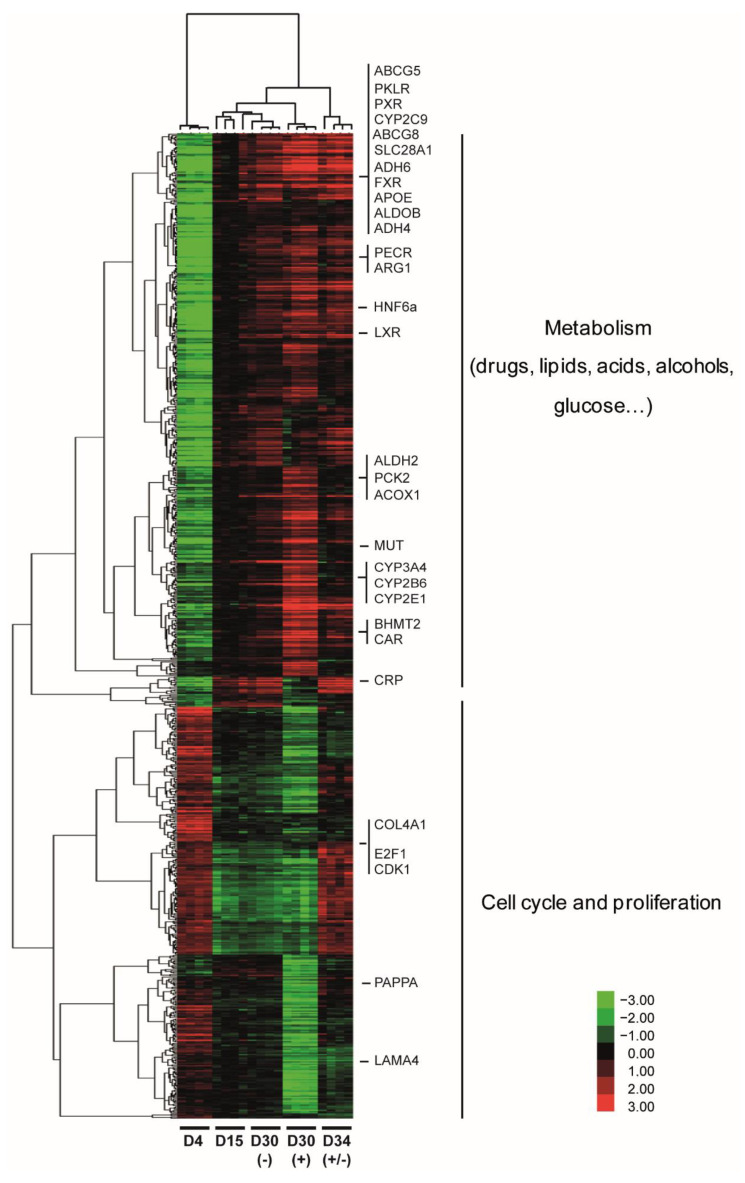
Figure 1.
Global gene expression profile during HepaRG cell differentiation. Global gene expression data were obtained from HepaRG cells at the end of each culture condition (D4, D15, D30 − DMSO, D30 + DMSO, and D34 ± DMSO). Each culture condition was performed four times. Global gene expression data were filtered and the 775 significantly deregulated genes (p < 0.001, FC > 3) were hierarchically clustered with Gene Cluster 3.0. Clusters and dendrograms of experiments and genes were visualized by Treeview. Green indicates lower expression and red indicates higher expression. Representative biological functions of each cluster were evaluated using FuncAssociate 2.0 program with a significance cutoff of 0.005.

