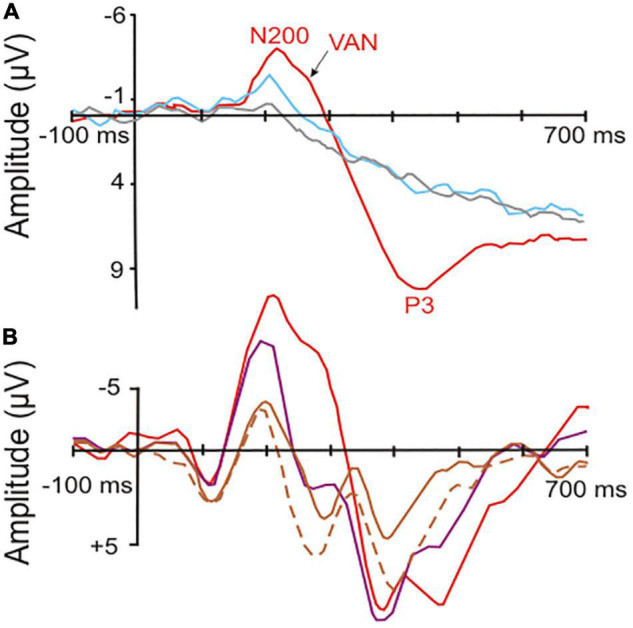
FIGURE 1.

Event-related potentials (ERPs) in response to visual stimuli (starting at the point of origin) in human observers. (A) Potentials recorded from surface electrodes above the occipital cortex contralateral to the stimulated visual field. Red curve, correct response with high-awareness; blue curve, correct response reported without awareness; gray curve, incorrect response without awareness. The red and blue curves show significant visual awareness with peaks near 200 ms latency (N200, visual awareness negativity, VAN) after stimulus onset. In addition, the red curve shows a so called P3 (positive peak later than 300 ms after stimulus onset), which is related to a conscious response [modified from Koivisto and Grassini (2016); part of their Figure 2]. (B) Potentials recorded from surface electrodes above the left-side posterior-temporal cortex to stimuli in the center of the visual field. Red curve, high-awareness with behavioral response to relevant stimulus; purple curve, low-awareness without response to irrelevant stimulus; brown curves, looking at masked relevant (solid line) or masked irrelevant stimulus (dashed line) without response requirement. The visual awareness negativities (peaks near 200 ms latency after stimulus onset) increase with increasing visibility and relevance of the stimuli corresponding to a respective increase in the awareness of the stimuli. Only the red curve shows a broad P3-like peak in the latency range of about 350–500 ms, possibly related to the required (conscious) behavioral response [modified from Koivisto and Revonsuo (2008); their Figure 7 at T5 of the left side].
