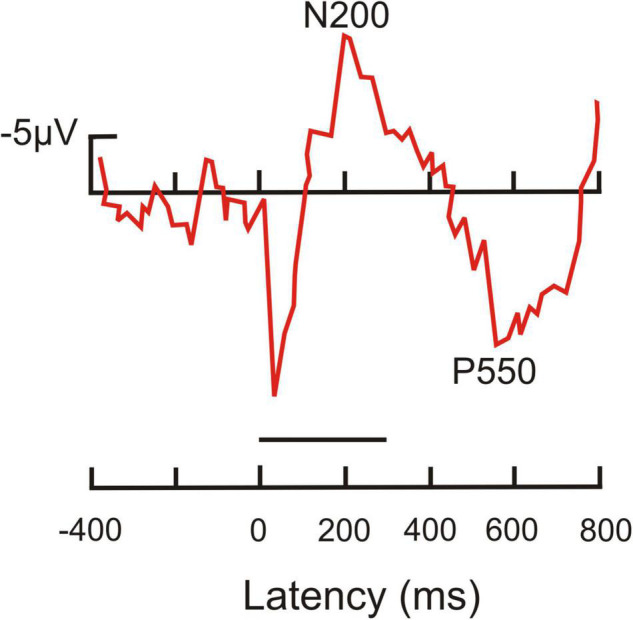
FIGURE 5.

Average ERP recorded from the head of a dolphin in response to a target tone. This tone had a duration of 300 ms (horizontal line above latency axis). It was followed by a second tone signaling conditioned access to a food reward. The ERP shows a prominent negativity peaking near 200 ms latency (N200) after tone onset, and a prominent positivity around 550 ms latency (P550). [Modified from Woods et al. (1986); their Figure 3.2 response to tone #3, target tone].
