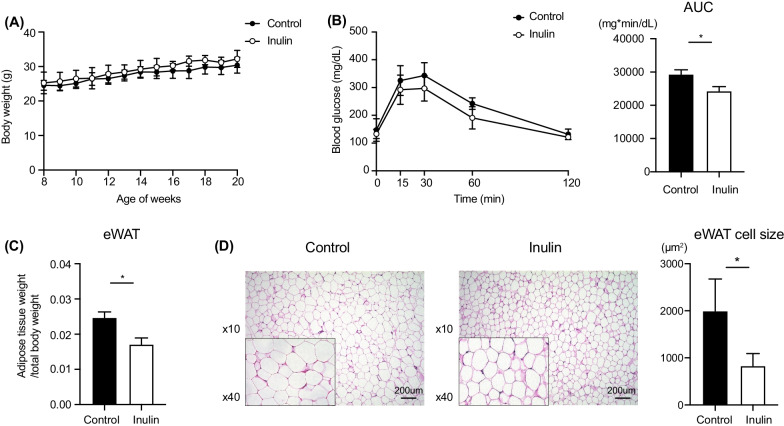
Fig. 1.
Effects of inulin on body weight gain, adipose tissue weight, and blood glucose in mice. A Body weight gain. Control: n = 12; Inulin group: n = 12. B Glucose tolerance test. The area under the curve (AUC) over the course of 120 min in each experiment was averaged. C Ratio of the weight of epididymal (eWAT) per body weight. D Histological examination of epididymal white adipose tissues (eWAT) using hematoxylin and eosin (H&E) staining. Scale bar = 200 µm. Area of average white adipocyte size in eWAT. Control: n = 6; Inulin group: n = 6. Data are expressed as means ± SEM. *p < 0.05

