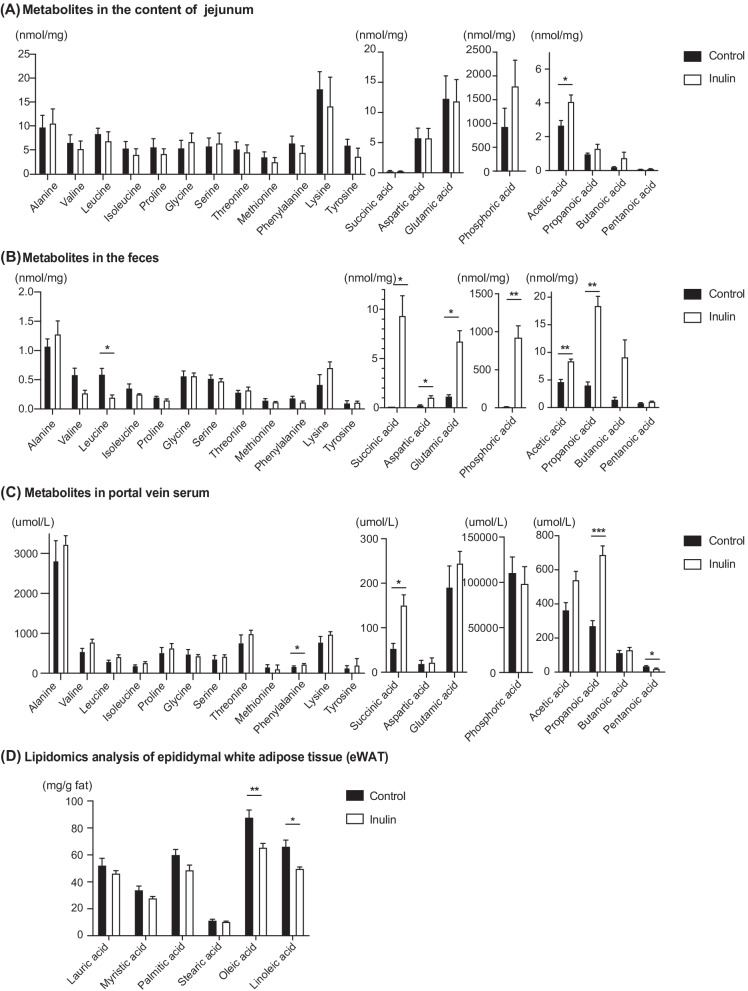
Fig. 4.
Results of the metabolomics analysis of the content of jejunum, feces, and portal vein serum. Lipidomics analysis. A Concentrations of amino acids, organic acids, and short-chain fatty acids (SCFAs) in the jejunum. B Concentrations of amino acids, organic acids, and short-chain fatty acids (SCFAs) in the feces. C Concentrations of amino acids, organic acids, and short-chain fatty acids (SCFAs) in the portal vein serum. D Lipidomics analysis of epididymal white adipose tissue (eWAT). Data are expressed as means ± SEM. *p < 0.05, **p < 0.01, ***p < 0.001. Control: n = 6; Inulin group: n = 6

